

Maps & Week/Day Views
Maps & Week/Day Views
Section titled “Maps & Week/Day Views”Pro - Everything on this page requires Eventonomy Pro.
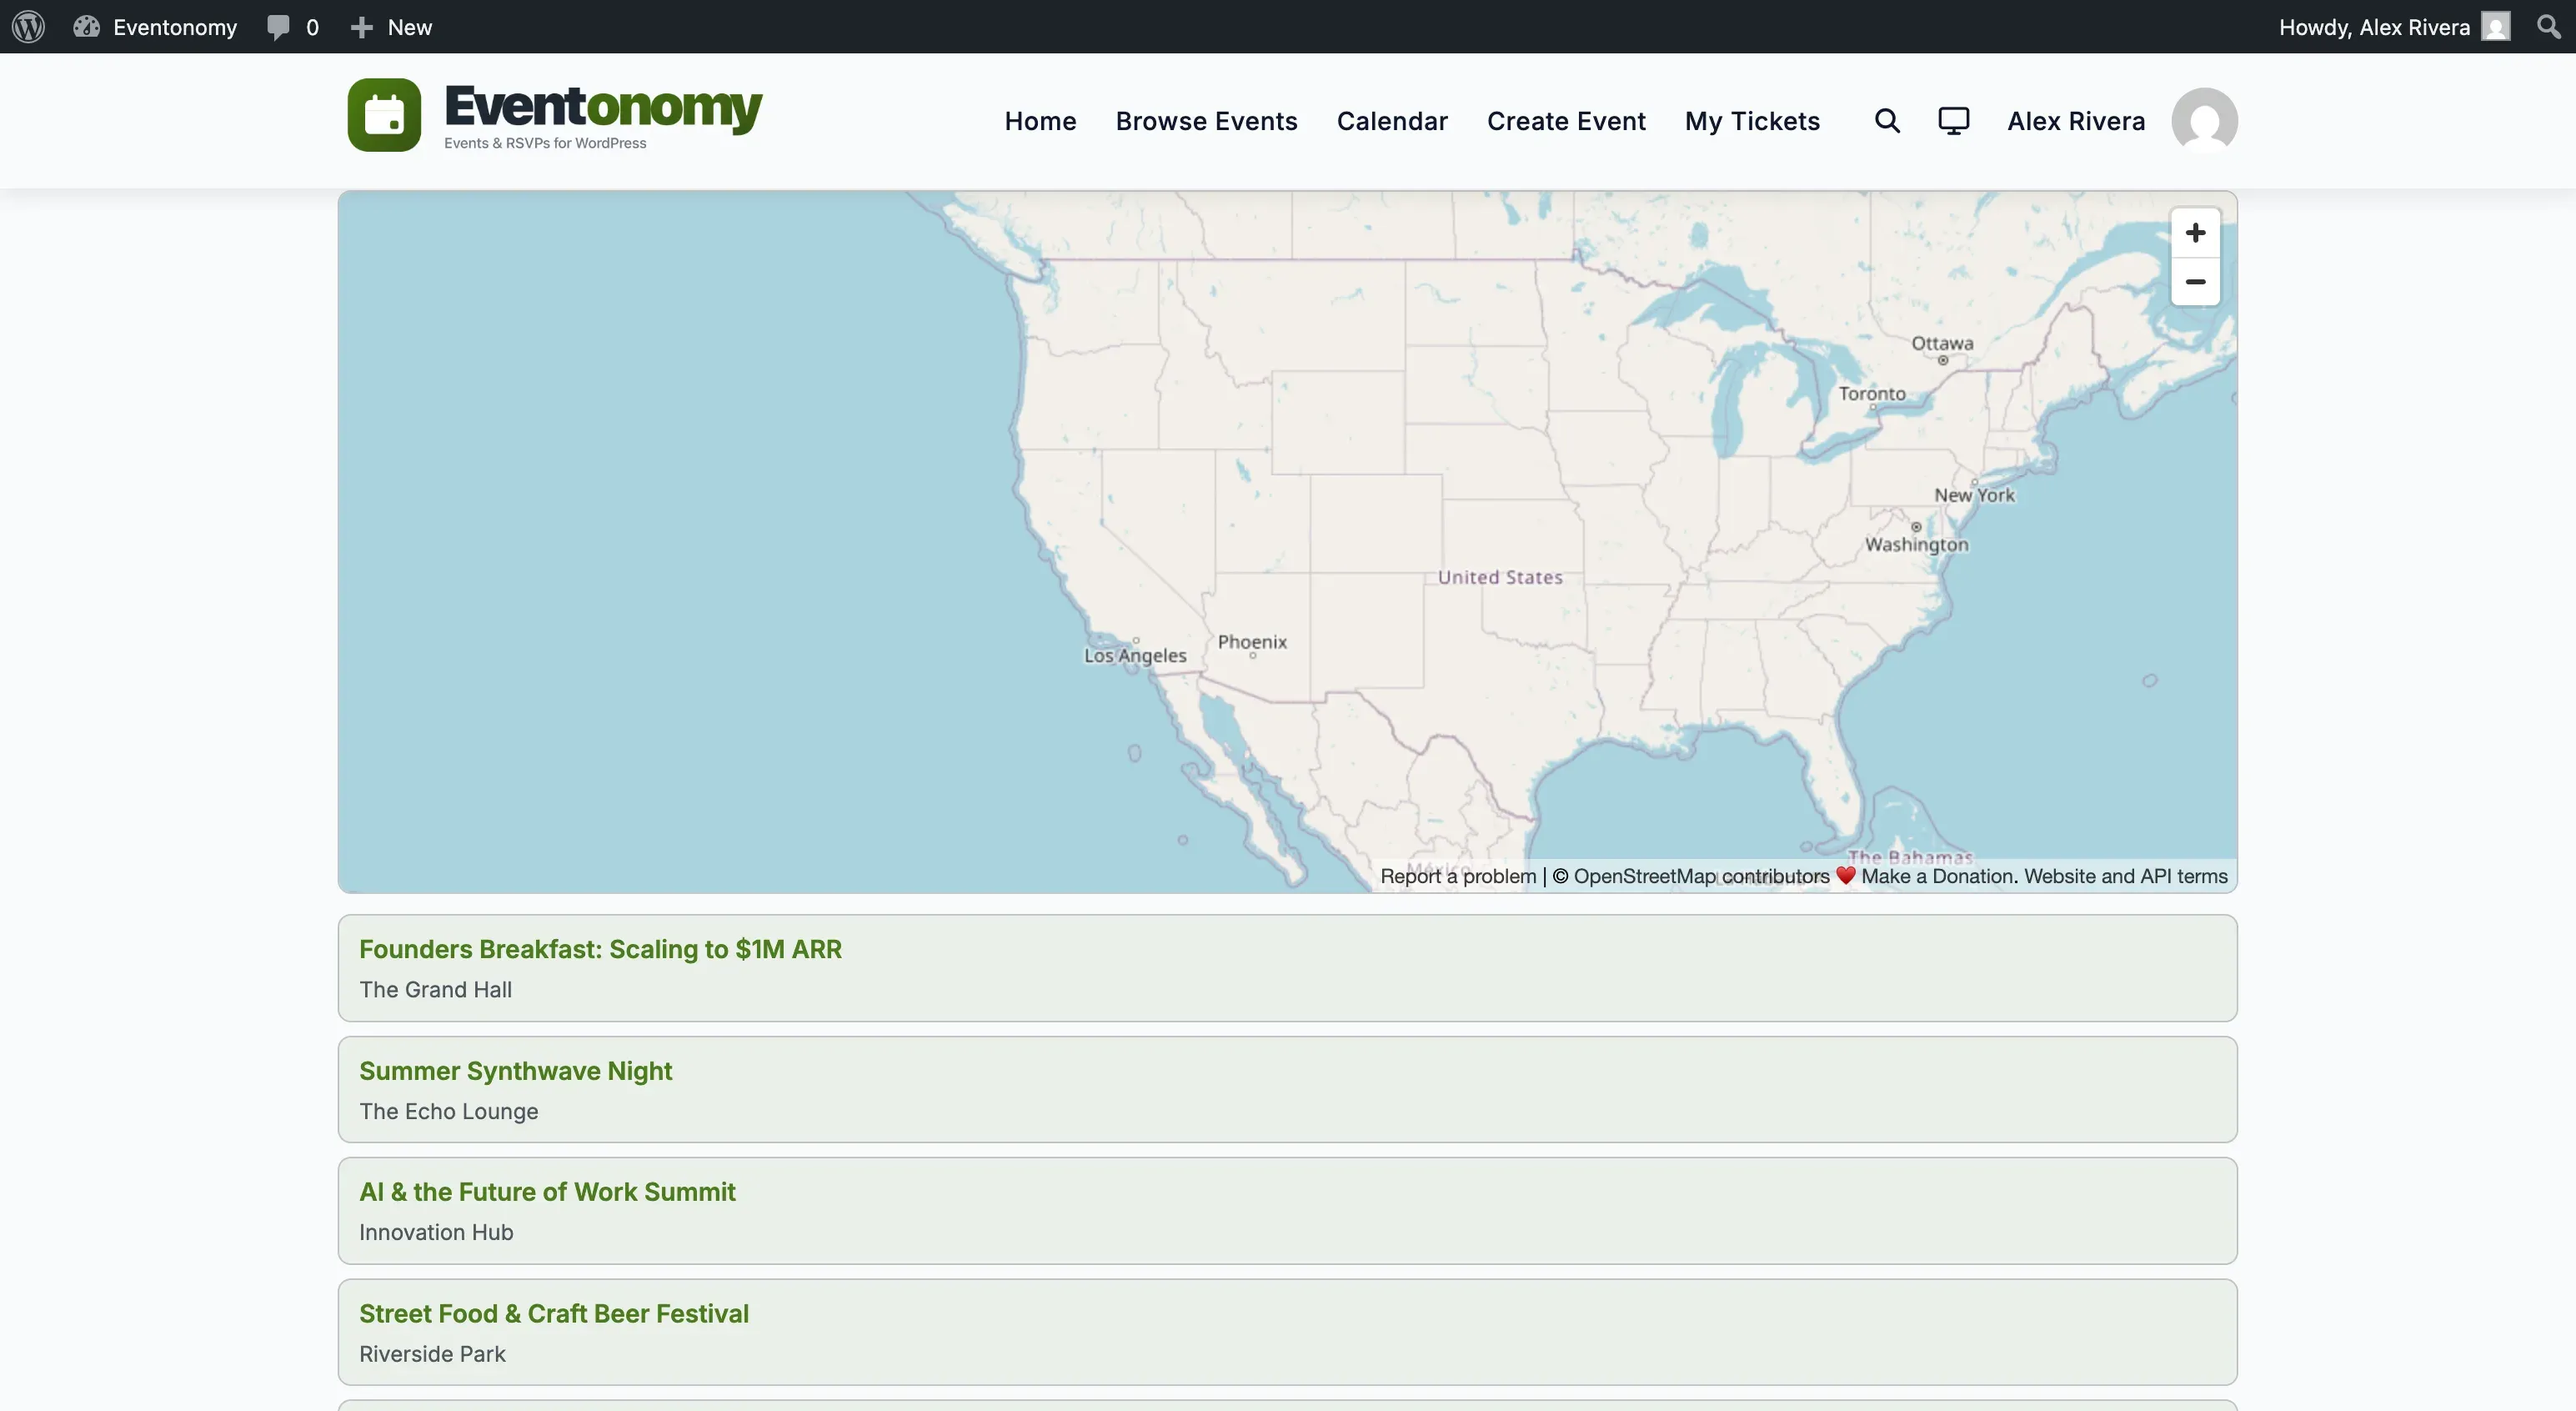
Eventonomy Pro adds three ways to see your events that the Free plan does not have: Week and Day hour-grid calendars, which join Grid / List / Month / Upcoming as real browse views with their own tab in the view switcher, and a map view, which is a block you place rather than a tab in the switcher.
What You Will Learn
Section titled “What You Will Learn”- How to enable and configure the map view
- Which geocoding providers are supported
- How to use the Week and Day calendar grids
- How to configure the hour range and slot size
Map View
Section titled “Map View”The map view uses the eventonomy-pro/map-view block to plot events as markers on an interactive map. Clicking a marker opens the event card.
Enabling Maps & Geocoding
Section titled “Enabling Maps & Geocoding”- Go to Eventonomy → Settings → Connections → Maps & geocoding.
- Toggle the feature on.
- Choose your geocoding provider.
- Enter your API key (if the provider requires one).
- Save changes.
Geocoding Providers
Section titled “Geocoding Providers”| Provider | API key required | Notes |
|---|---|---|
| Nominatim | No | OpenStreetMap-based; free; rate-limited. Suitable for low-volume sites. |
| Mapbox | Yes | Fast, scalable, excellent tile quality. Requires a Mapbox token. |
| Google Maps | Yes | Most accurate geocoding; requires a Google Cloud API key with Maps JavaScript API and Geocoding API enabled. |
How Geocoding Works
Section titled “How Geocoding Works”When an event is saved with a venue address, Eventonomy sends the address to the configured provider and stores the resulting lat/lng coordinates in the venue catalog. On the single-event page, the map is rendered using the stored coordinates, with no real-time geocoding on the frontend.
If Settings → Appearance → Show a location map on the single event is on and the event has a geocoded address, an embedded map appears automatically.
Map Display Options
Section titled “Map Display Options”Beneath the geocoding fields in the Maps & geocoding card, Pro adds two display settings:
| Setting | Default | What it controls |
|---|---|---|
Default map zoom (evnm_pro_map_default_zoom) |
15 |
Zoom level (1 to 19, higher = more zoomed in) for the single-event map embed. |
Show a map above the events list (evnm_pro_map_on_archive) |
Off | When on, a bounding-box map is rendered above the events listing. |
Placing the Map Block
Section titled “Placing the Map Block”Add the eventonomy-pro/map-view block to your Events page (or any page). It shows all published events with geocoded addresses as markers.
Week View
Section titled “Week View”The week view shows 7 days in a column grid, with events positioned vertically according to their start and end time. Use the eventonomy-pro/week-view block.
Configuring the Week View
Section titled “Configuring the Week View”Go to Settings → Appearance → Calendar view:
| Setting | What it controls |
|---|---|
| Day starts at | First hour shown in the hour grid (0 to 23, 24-hour format) |
| Day ends at | Last hour shown in the hour grid |
| Time slot size | Granularity of the grid: 15, 30, or 60 minutes |
Directly beneath the hour-grid fields, Pro adds two Week & Day grid caps so a busy calendar stays readable:
| Setting | Default | What it controls |
|---|---|---|
Max events per time slot (evnm_pro_max_per_slot) |
0 (no limit) |
When a slot holds more than this many events, the overflow is replaced by a “+X more” indicator in the cell. |
Max events per day (total across all slots) (evnm_pro_max_per_day) |
0 (no limit) |
When a day holds more than this many events, overflow slots are suppressed and a day-level “+X more” indicator is shown. |
Day View
Section titled “Day View”The day view shows a single day in the same hour-grid format as the week view. Use the eventonomy-pro/day-view block.
The same hour range and slot size settings from the Calendar view section apply to both week and day grids.
Setting Week or Day as the Default View
Section titled “Setting Week or Day as the Default View”Go to Settings → Appearance → Event views → Default view and choose Week or Day. The bare /events/ URL will open that view.
What’s Next?
Section titled “What’s Next?”Configure email notifications for RSVPs and event submissions.