

Dashboard Home
Overview
Section titled “Overview”The dashboard home is the first thing you see when you log in. It gives you a live snapshot of everything relevant to your role — whether you’re a student tracking your progress, an instructor managing courses, or a group leader overseeing your team.
Screenshots
Section titled “Screenshots”How It Looks
Section titled “How It Looks”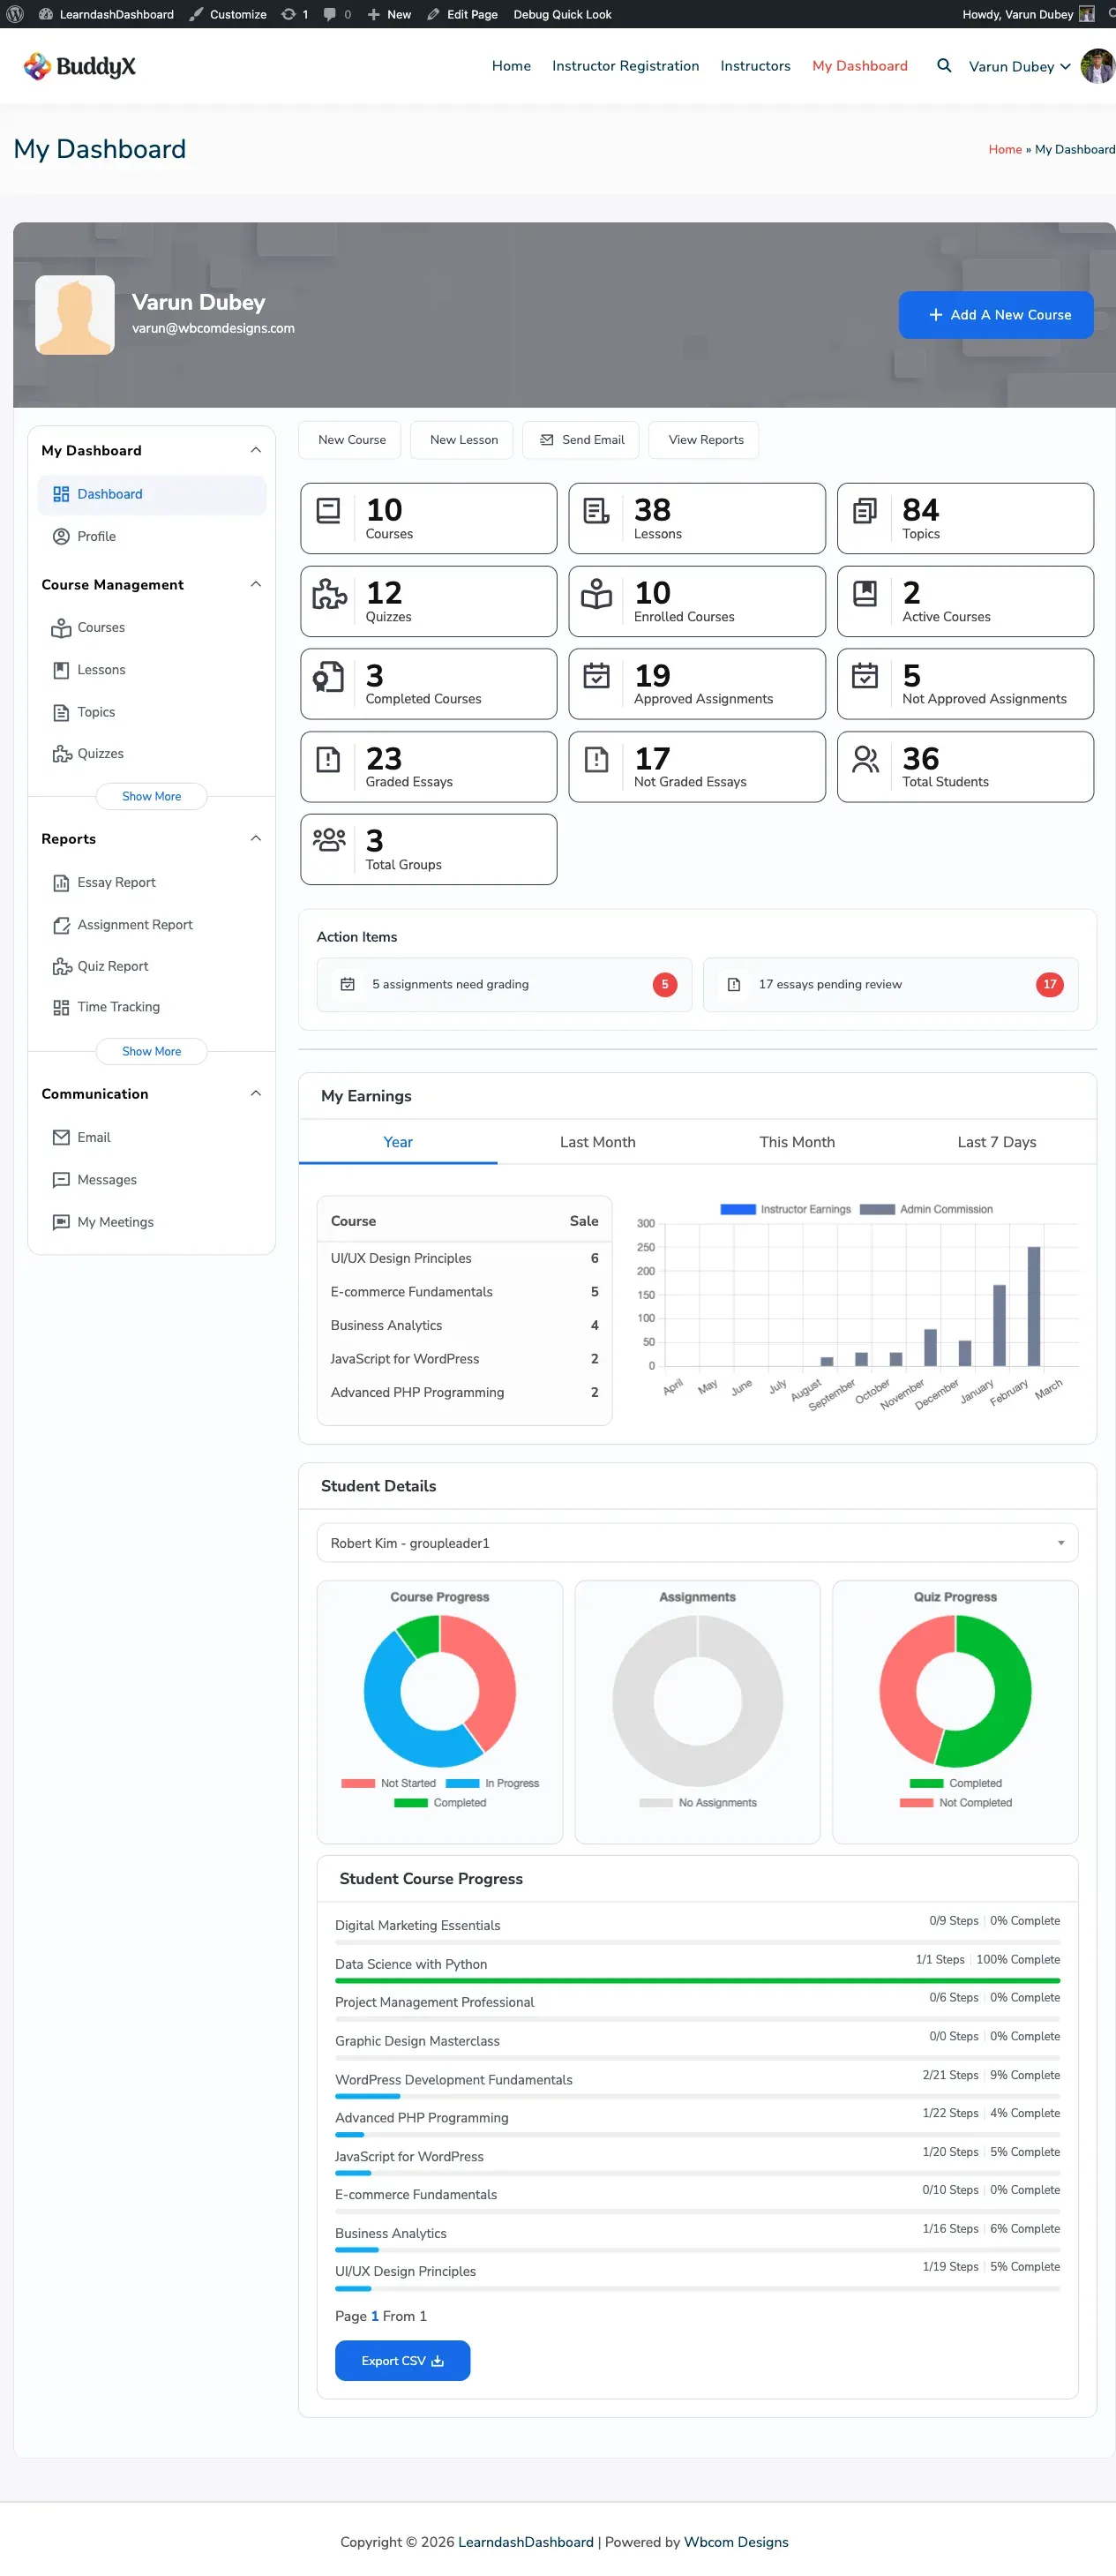
What You’ll See
Section titled “What You’ll See”The dashboard home adapts to who you are. Here’s what each role sees.
Students
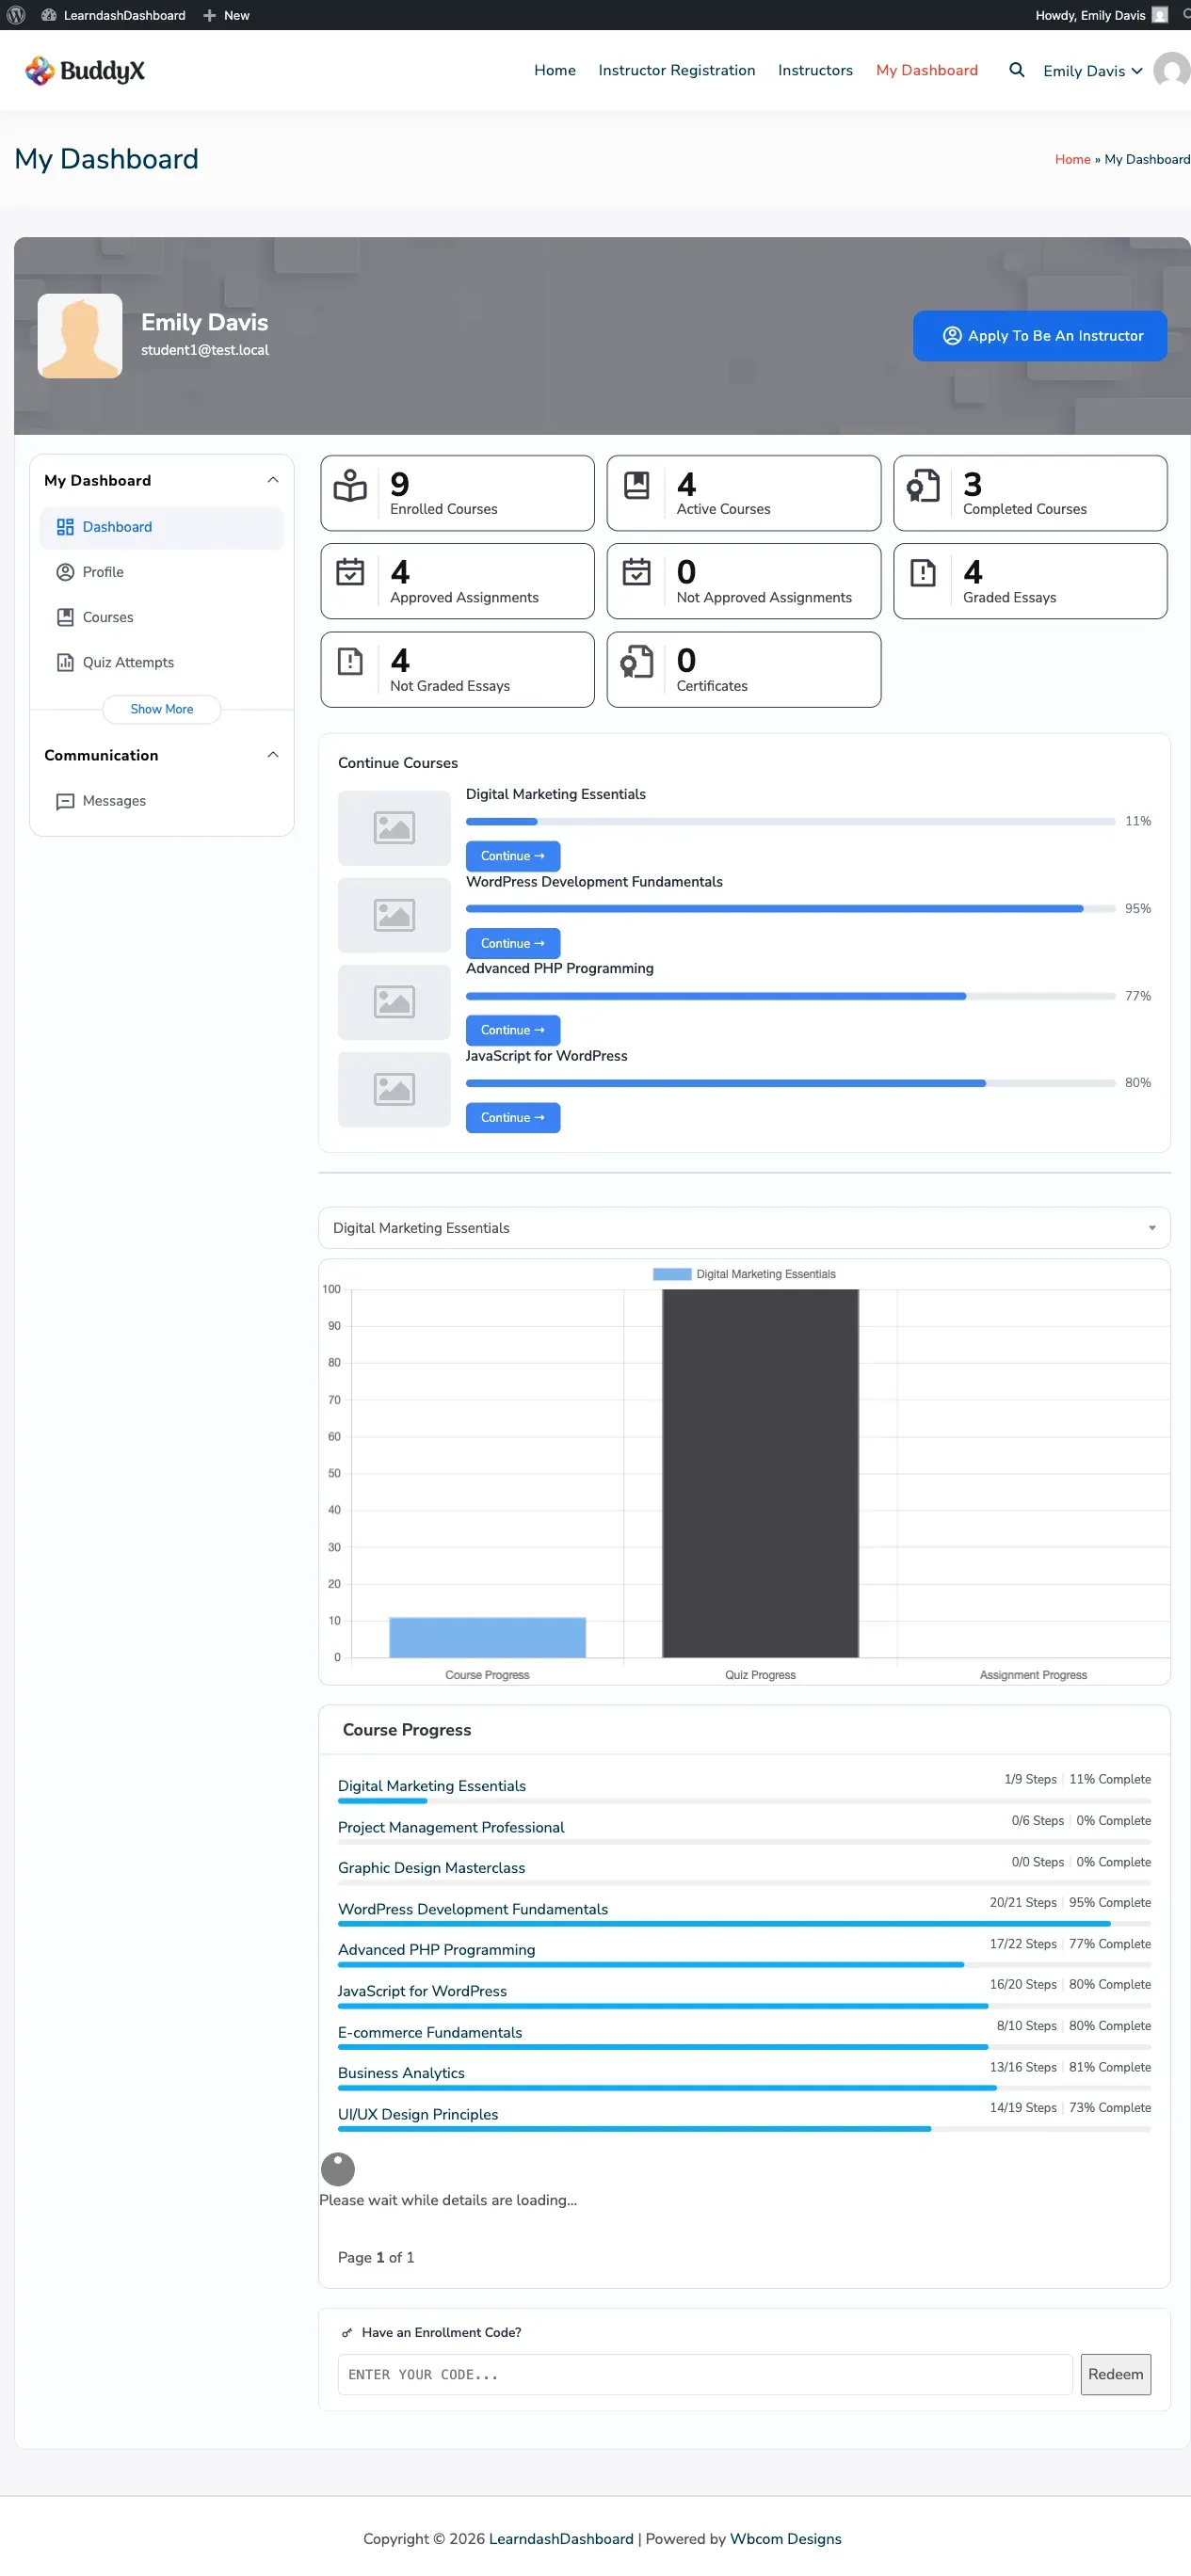
Section titled “Students”At the top of your dashboard, four tiles show your learning progress at a glance:
| Tile | What It Shows |
|---|---|
| Enrolled Courses | Total courses you’re enrolled in |
| In Progress | Courses you’ve started but not finished |
| Completed | Courses you’ve finished |
| Certificates | Certificates you’ve earned |
Below the tiles, you’ll see a list of your enrolled courses with progress bars so you can pick up where you left off.
If your site uses enrollment codes, you’ll also see a box where you can enter a code to join a new course instantly.
Instructors
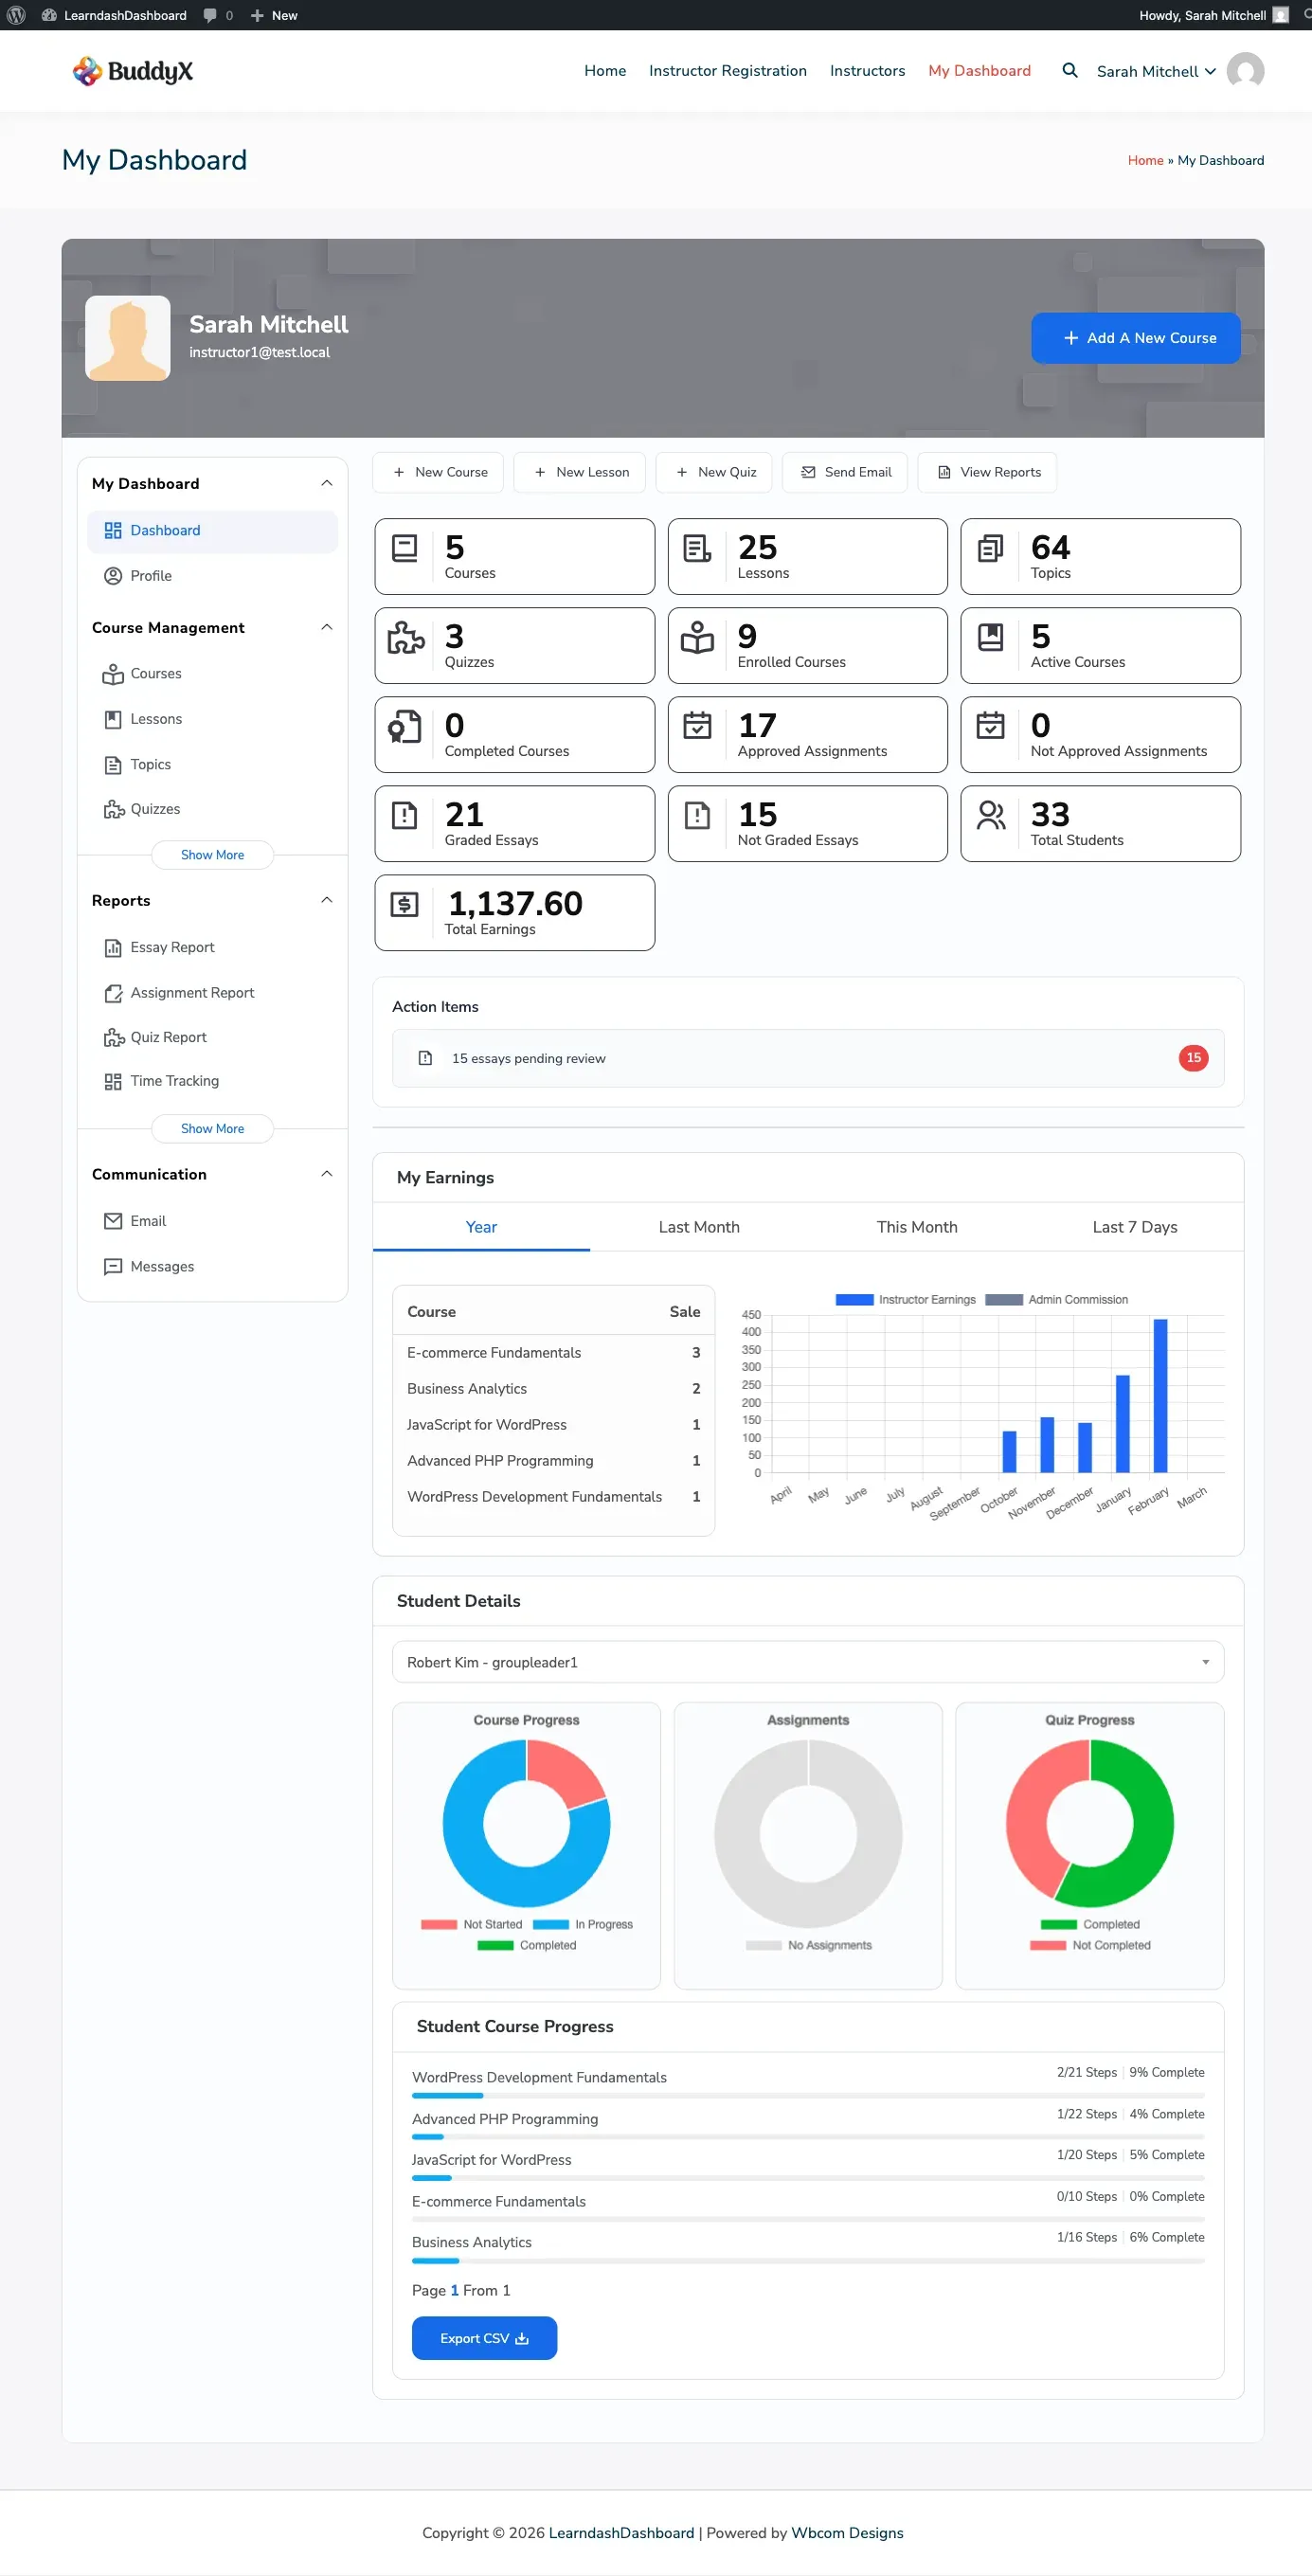
Section titled “Instructors”Instructors see tiles for their own courses, lessons, quizzes, and students. Below the tiles, an earnings chart shows your revenue over time. Use the filter to switch between This Month, Last Month, Last 7 Days, or Year.
You also see a student list widget so you can quickly check who’s enrolled in your courses.
Group Leaders
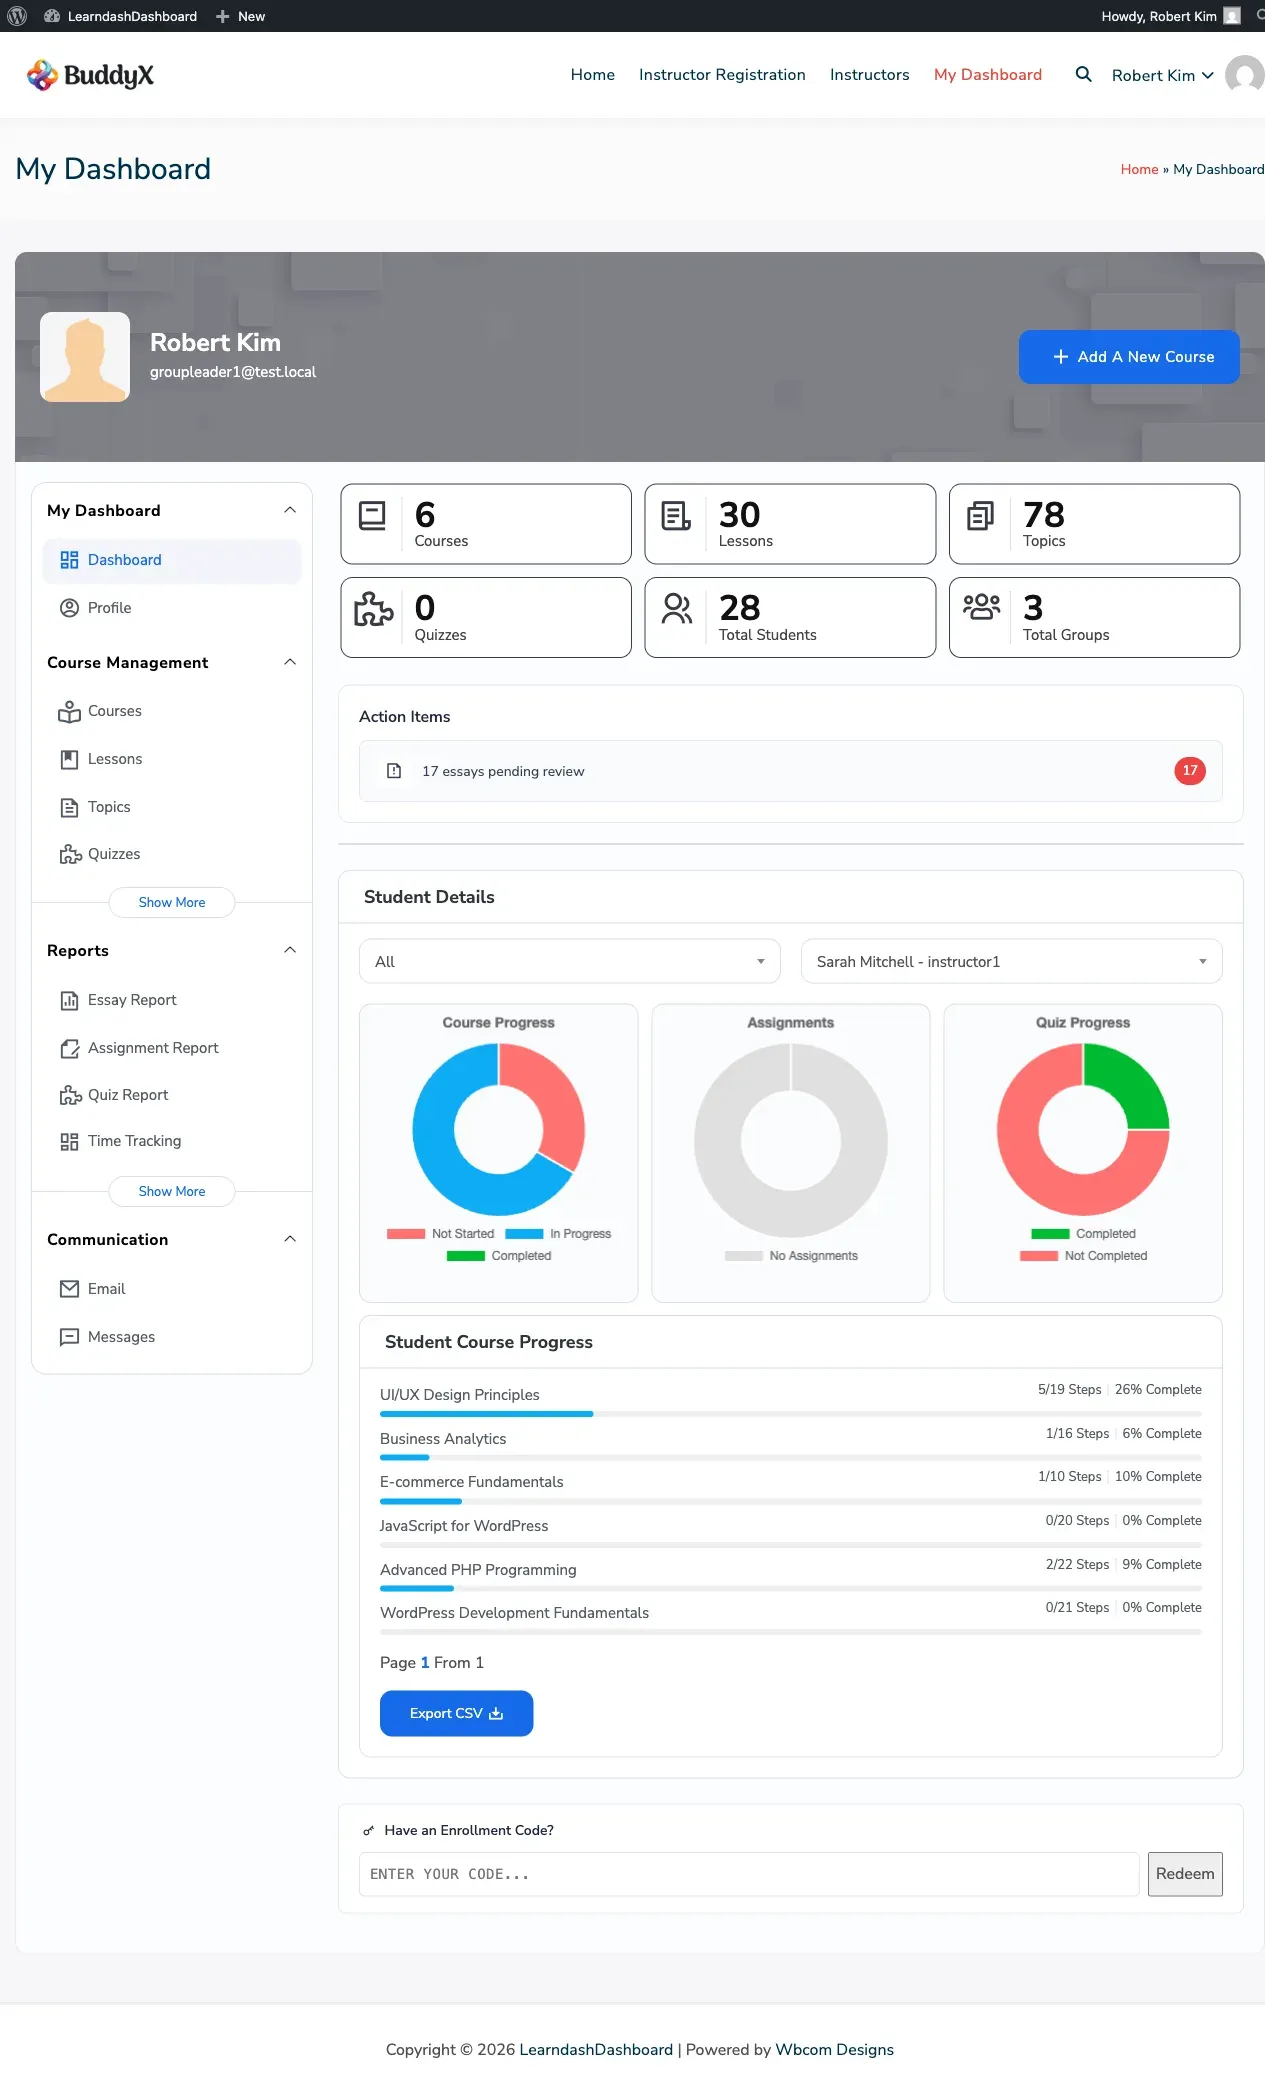
Section titled “Group Leaders”Group leaders see tiles for the courses, students, lessons, and quizzes in their assigned groups.
Administrators
Section titled “Administrators”Admins see site-wide counts — total courses, lessons, topics, quizzes, students, and assignments — plus an earnings chart covering all instructors on the site.
Quick Action Buttons
Section titled “Quick Action Buttons”Admins and instructors see a row of quick action buttons at the top of the dashboard. These let you jump straight to common tasks:
- New Course — Start building a new course
- New Lesson — Add a lesson to an existing course
- New Quiz — Create a quiz
- Send Email — Open the email tool to message students
- View Reports — Go straight to your reports section
Configuring the Dashboard Home
Section titled “Configuring the Dashboard Home”You can control what appears on the dashboard home from your admin panel.
- Go to WP Admin > LearnDash Dashboard
- Use the settings below to adjust what’s shown:
| Setting Area | What You Can Change |
|---|---|
| Dashboard Statistics | Choose which stat tiles appear (see full list below) |
| General Settings > Dashboard Components | Turn course progress and student details on or off |
| Monetization | Enable the earnings chart for instructors |
| Welcome Screen | Customize the profile banner image and text |
Dashboard Statistics — All Tile Options
Section titled “Dashboard Statistics — All Tile Options”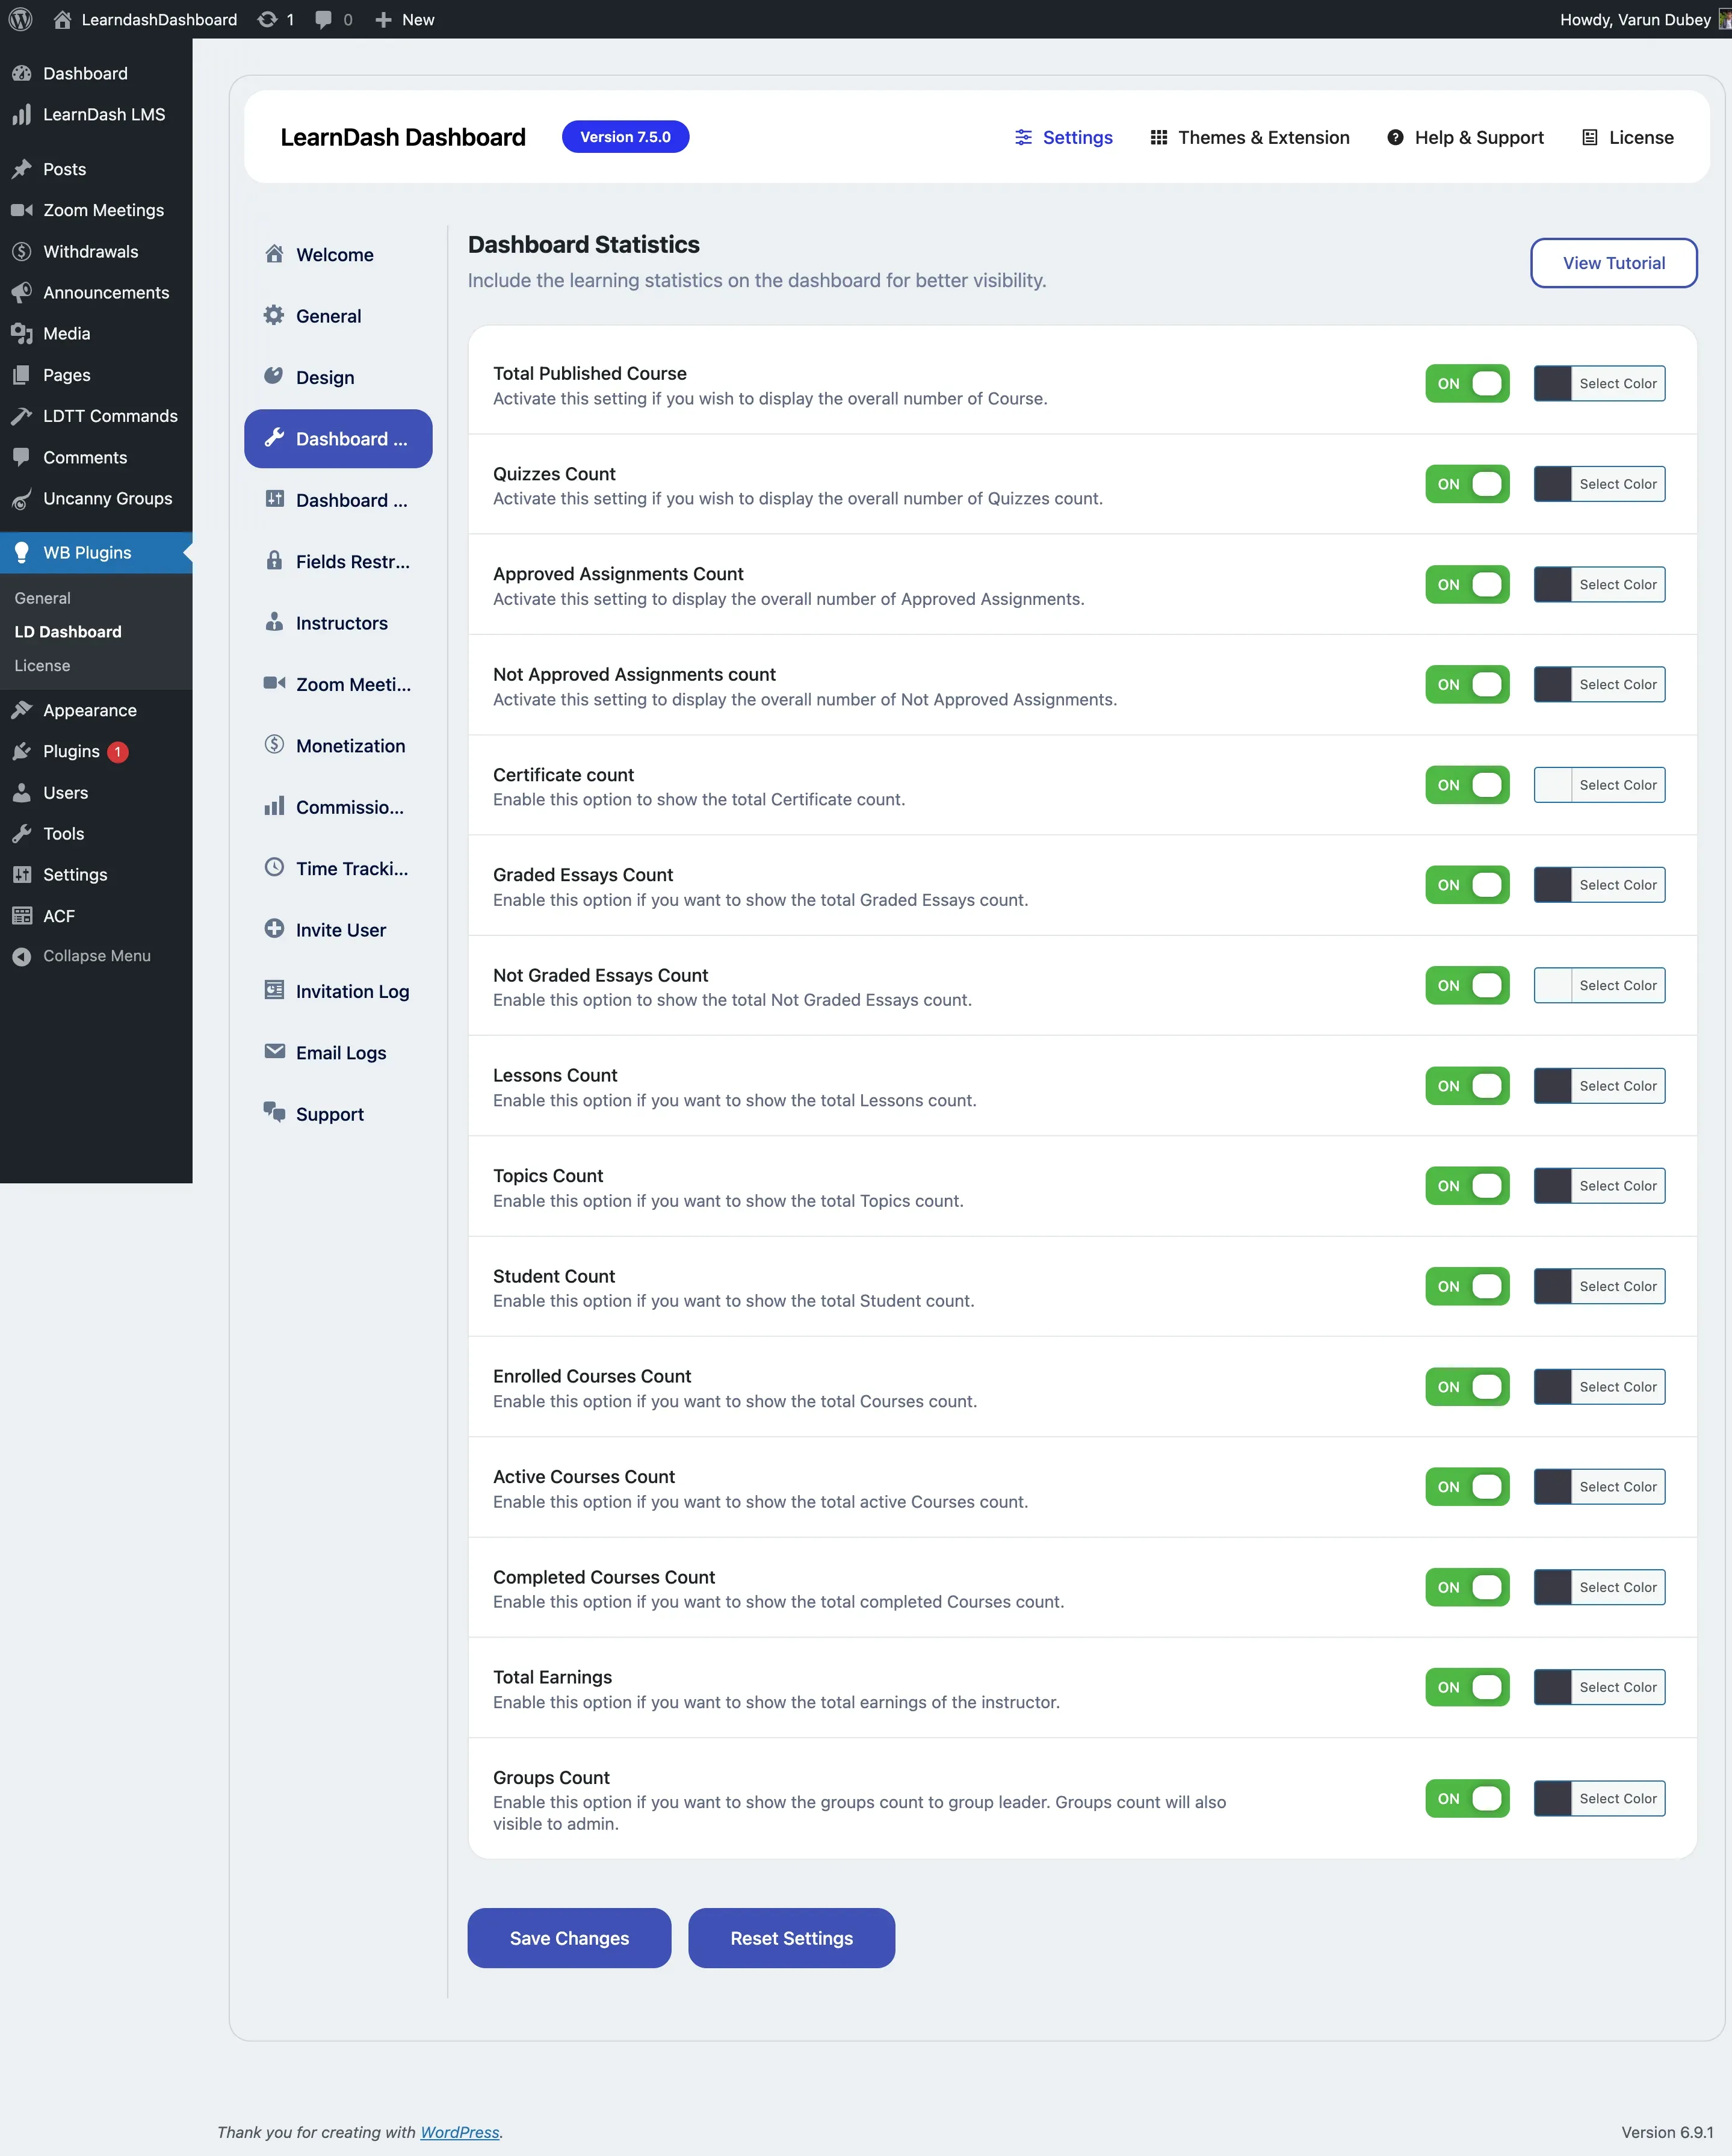
Go to WP Admin > LearnDash Dashboard > Dashboard Statistics to toggle individual tiles on or off and set each tile’s icon color.
| Tile | What It Shows | Visible To |
|---|---|---|
| Total Published Courses | Total number of published courses on the site | Admin, Instructor |
| Quizzes Count | Total number of quizzes | Admin, Instructor |
| Approved Assignments Count | Assignments that have been approved | Admin, Instructor |
| Not Approved Assignments Count | Assignments still pending approval | Admin, Instructor |
| Certificate Count | Total certificates available | Admin, Instructor |
| Graded Essays Count | Essays that have been graded | Admin, Instructor |
| Not Graded Essays Count | Essays still awaiting grading | Admin, Instructor |
| Lessons Count | Total number of lessons | Admin, Instructor |
| Topics Count | Total number of topics | Admin, Instructor |
| Student Count | Total number of students | Admin, Instructor |
| Enrolled Courses Count | Courses the current user is enrolled in | Student |
| Active Courses Count | Courses the user has started but not completed | Student |
| Completed Courses Count | Courses the user has finished | Student |
| Total Earnings | Instructor’s total revenue | Instructor |
| Groups Count | Number of groups assigned to the user | Group Leader, Admin |
Each tile also has a color picker to set the icon color, so you can match your site’s branding.