

Insights Dashboard
Overview
Section titled “Overview”The Insights tab gives you a visual snapshot of how your courses and students are performing. Charts update automatically when you change the date range. Each chart can be turned on or off by your site administrator.
Admins, instructors, and group leaders all have access to Insights. Students do not.
Screenshots
Section titled “Screenshots”Admin View
Section titled “Admin View”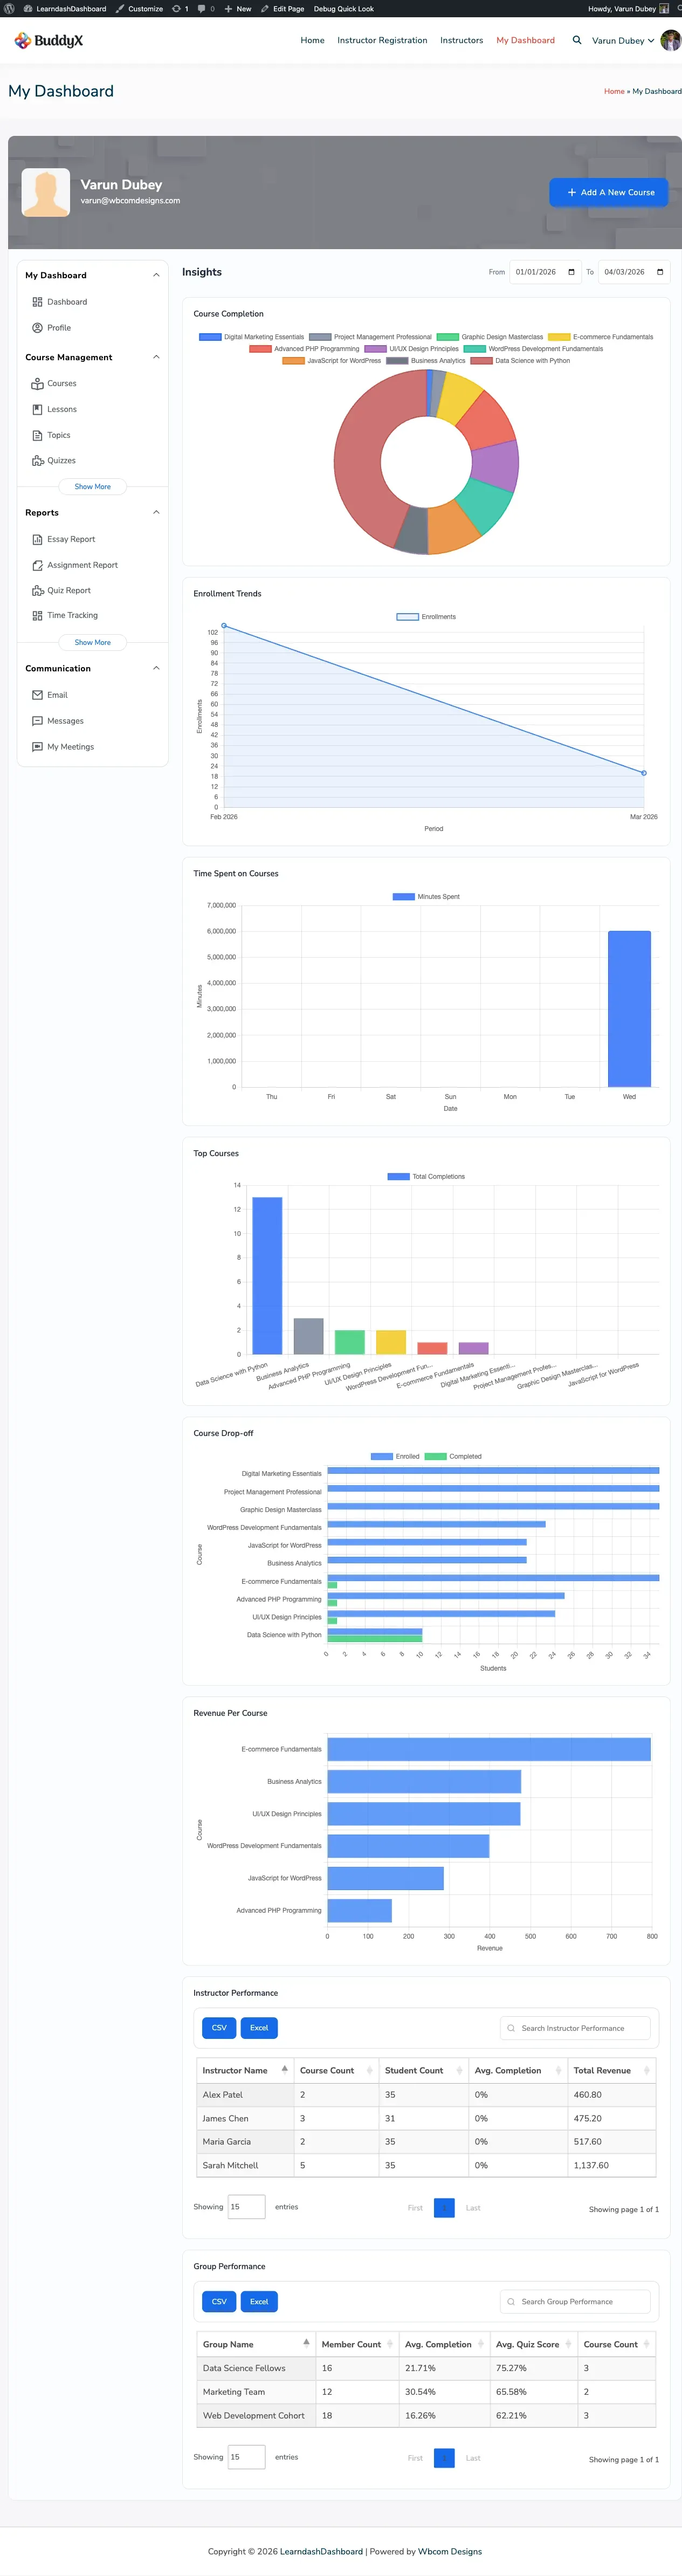
Instructor View
Section titled “Instructor View”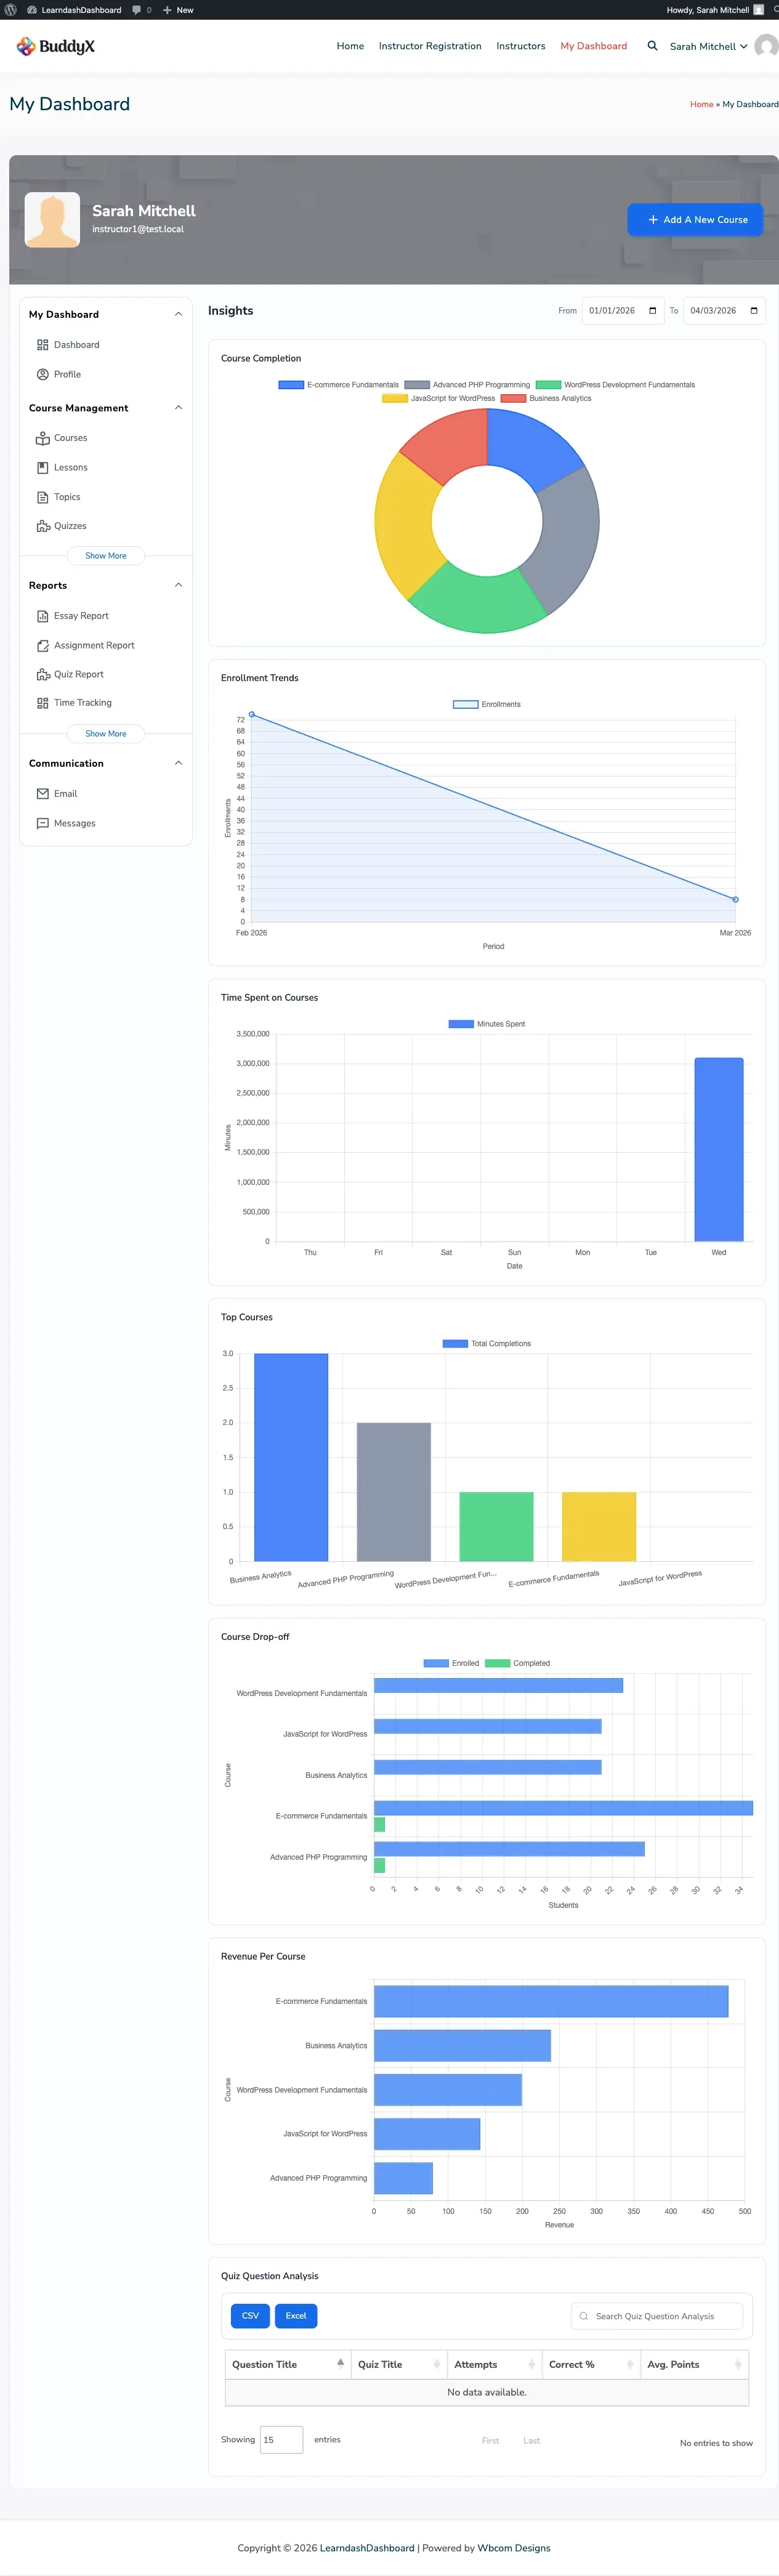
Group Leader View
Section titled “Group Leader View”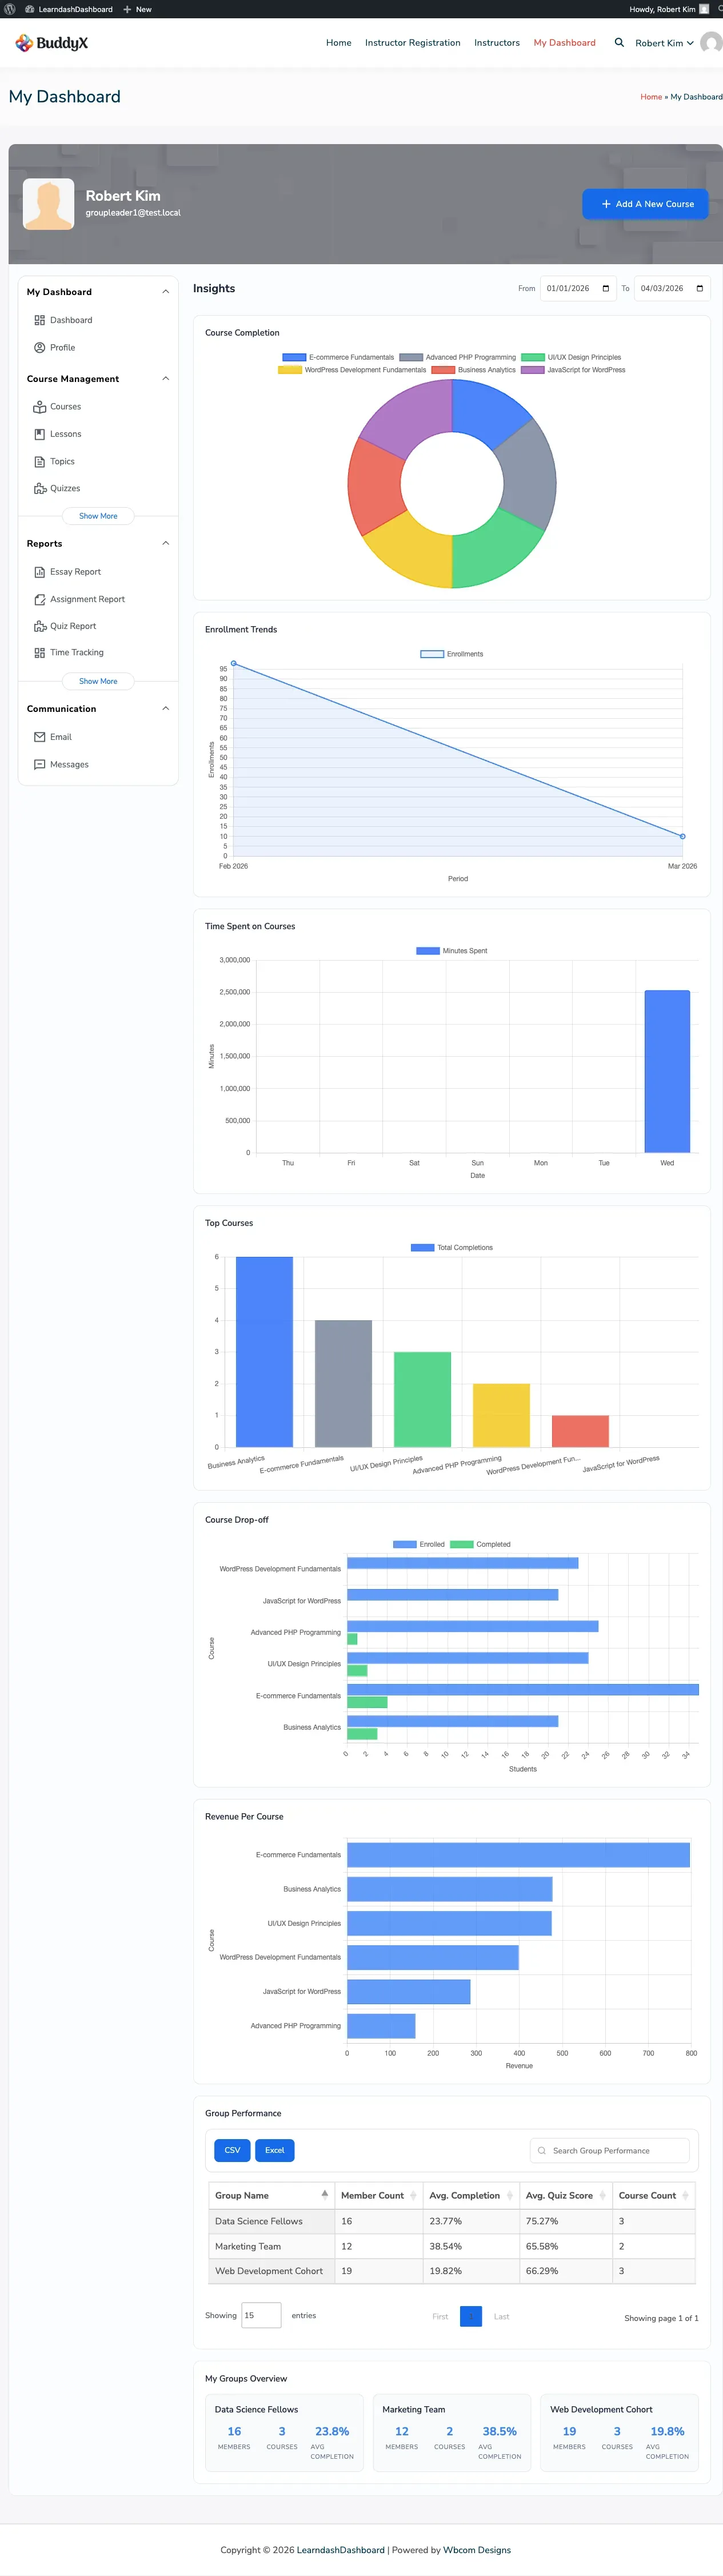
How to Access Insights
Section titled “How to Access Insights”Go to your dashboard and click Insights in the sidebar menu.
Filtering by Date Range
Section titled “Filtering by Date Range”Use the From and To date fields at the top of the page to focus all charts on a specific time period. The default view covers the current calendar year.
Available Charts
Section titled “Available Charts”Course Completion Rate
Section titled “Course Completion Rate”Shows what percentage of students have completed, are in progress, or have not yet started your courses. Summary tiles below the chart display the total number of students, how many completed, how many are in progress, and how many have not started.
Enrollment Trends
Section titled “Enrollment Trends”A line chart that tracks new enrollments over time. Use this to spot busy periods or measure how well a promotion performed.
Time Spent on Courses
Section titled “Time Spent on Courses”Shows the total time students have spent learning across your courses. Requires the Time Tracking feature to be enabled on your site.
Top Courses
Section titled “Top Courses”Ranks your courses by the number of completions in the selected date range. Quickly see which courses are most popular.
- Admins see all courses.
- Instructors see their own courses.
- Group Leaders see courses assigned to their groups.
Course Drop-off
Section titled “Course Drop-off”Shows the lesson or topic where students most often stop progressing. Use this to identify content that may need improvement.
Revenue Per Course
Section titled “Revenue Per Course”Shows earnings broken down by course. Only visible when the monetization feature is active on your site.
Instructor Performance
Section titled “Instructor Performance”An admin-only table comparing instructors by number of courses, enrolled students, completion rate, and average quiz scores.
Group Performance
Section titled “Group Performance”Compares groups by enrolled students, average completion, and quiz pass rates. Visible to admins and group leaders.
Quiz Question Analysis
Section titled “Quiz Question Analysis”An instructor-only table showing which quiz questions have the lowest correct-answer rates. Helps you spot questions that may be confusing or too difficult.
What Each Role Can See
Section titled “What Each Role Can See”| Chart | Admin | Instructor | Group Leader |
|---|---|---|---|
| Course Completion | All courses | Own courses | Assigned groups |
| Enrollment Trends | All | Own | Assigned |
| Time Spent | All | Own | Assigned |
| Top Courses | All | Own | Assigned |
| Course Drop-off | All | Own | Assigned |
| Revenue Per Course | Yes | Yes | Yes |
| Instructor Performance | Yes | No | No |
| Group Performance | Yes | No | Yes |
| Quiz Question Analysis | No | Yes | No |
Configuring Chart Visibility
Section titled “Configuring Chart Visibility”Your site administrator can turn individual charts on or off at Admin > General Settings. Each chart also has a role-visibility setting to control which user types can see it.