

Analytics & Reports
Analytics & Reports
Section titled “Analytics & Reports”Pro - Both surfaces described on this page require Eventonomy Pro.
Eventonomy Pro adds two analytics surfaces: the Organizer Analytics block gives each organizer a quick personal summary on the frontend, and the backend Reports page gives site admins a site-wide view of events, attendance, revenue, and audience.
What You Will Learn
Section titled “What You Will Learn”- What KPIs the Organizer Analytics block shows
- Where to place the Organizer Analytics block
- What the backend Reports page covers
- How to enable Analytics (required for both surfaces)
Enabling Analytics
Section titled “Enabling Analytics”Both surfaces require the Analytics feature toggle:
- Go to Eventonomy → Settings → Features.
- Find the Analytics feature card (Pro, locked in Free).
- Toggle it on and save.
Until you do this the backend Reports page shows an “Analytics is turned off” state, and the Organizer Analytics block is not registered at all, so it will not appear in the block inserter. Switching the toggle on brings both back.
Organizer Analytics Block (eventonomy-pro/organizer-analytics)
Section titled “Organizer Analytics Block (eventonomy-pro/organizer-analytics)”The Organizer Analytics block gives the currently logged-in organizer a summary of their own events. It renders server-side with no separate API call needed.
Only logged-in users see data. Visitors see a “Please log in” notice.
What It Shows
Section titled “What It Shows”| Metric | Description |
|---|---|
| Events | Total number of events the organizer has created (all statuses). |
| Total RSVPs | Aggregate RSVP count across all the organizer’s events. |
| Top events table | A table of the organizer’s events with per-event RSVP counts. |
Note: Revenue is not exposed by the Organizer Analytics block. Revenue is not hidden from organizers everywhere, though: the frontend Manage Attendees → Sales panel (a Free feature, gated on the event-scoped
manage_orderscapability) shows four stats for an event - Revenue, Paid orders, Going (people), and RSVPs (registrations). With Pro active and Vendor earnings & platform fee switched on under Settings → Payments, two more appear: Your net earnings and Platform fee. Leave that switch off and neither card renders, because nothing has been booked to the ledger. See Attendees & Orders and Earnings & Payouts.
Reading the Two Attendance Numbers
Section titled “Reading the Two Attendance Numbers”The Manage Attendees panel shows Going (people) and RSVPs (registrations) side by side, and for the same event they will often disagree. That is by design, not a reporting fault:
- Going (people) is a headcount. A registrant who brings three guests counts as 4.
- RSVPs (registrations) is a sign-up count. That same registrant counts as 1.
An event with 7 sign-ups where several people brought a guest reads Going (people) 10 and RSVPs (registrations) 7. Compare the right one when reconciling against this page: the RSVPs KPI card below and the Top events by attendance table both rank on RSVP counts, so they line up with RSVPs (registrations), not with the headcount.
Block Attributes
Section titled “Block Attributes”| Setting | Default | Description |
|---|---|---|
| Show attendees | On | Show the RSVPs metric and the top-events table. Turn off for a minimal event-count-only display. |
Where to Place It
Section titled “Where to Place It”- Member dashboard - Embed the block in the overview area of a member-facing dashboard page alongside the
eventonomy/my-eventsblock. - Organizer profile pages - Place it on a page visible only to logged-in organizers.
Backend Reports Page (Admin)
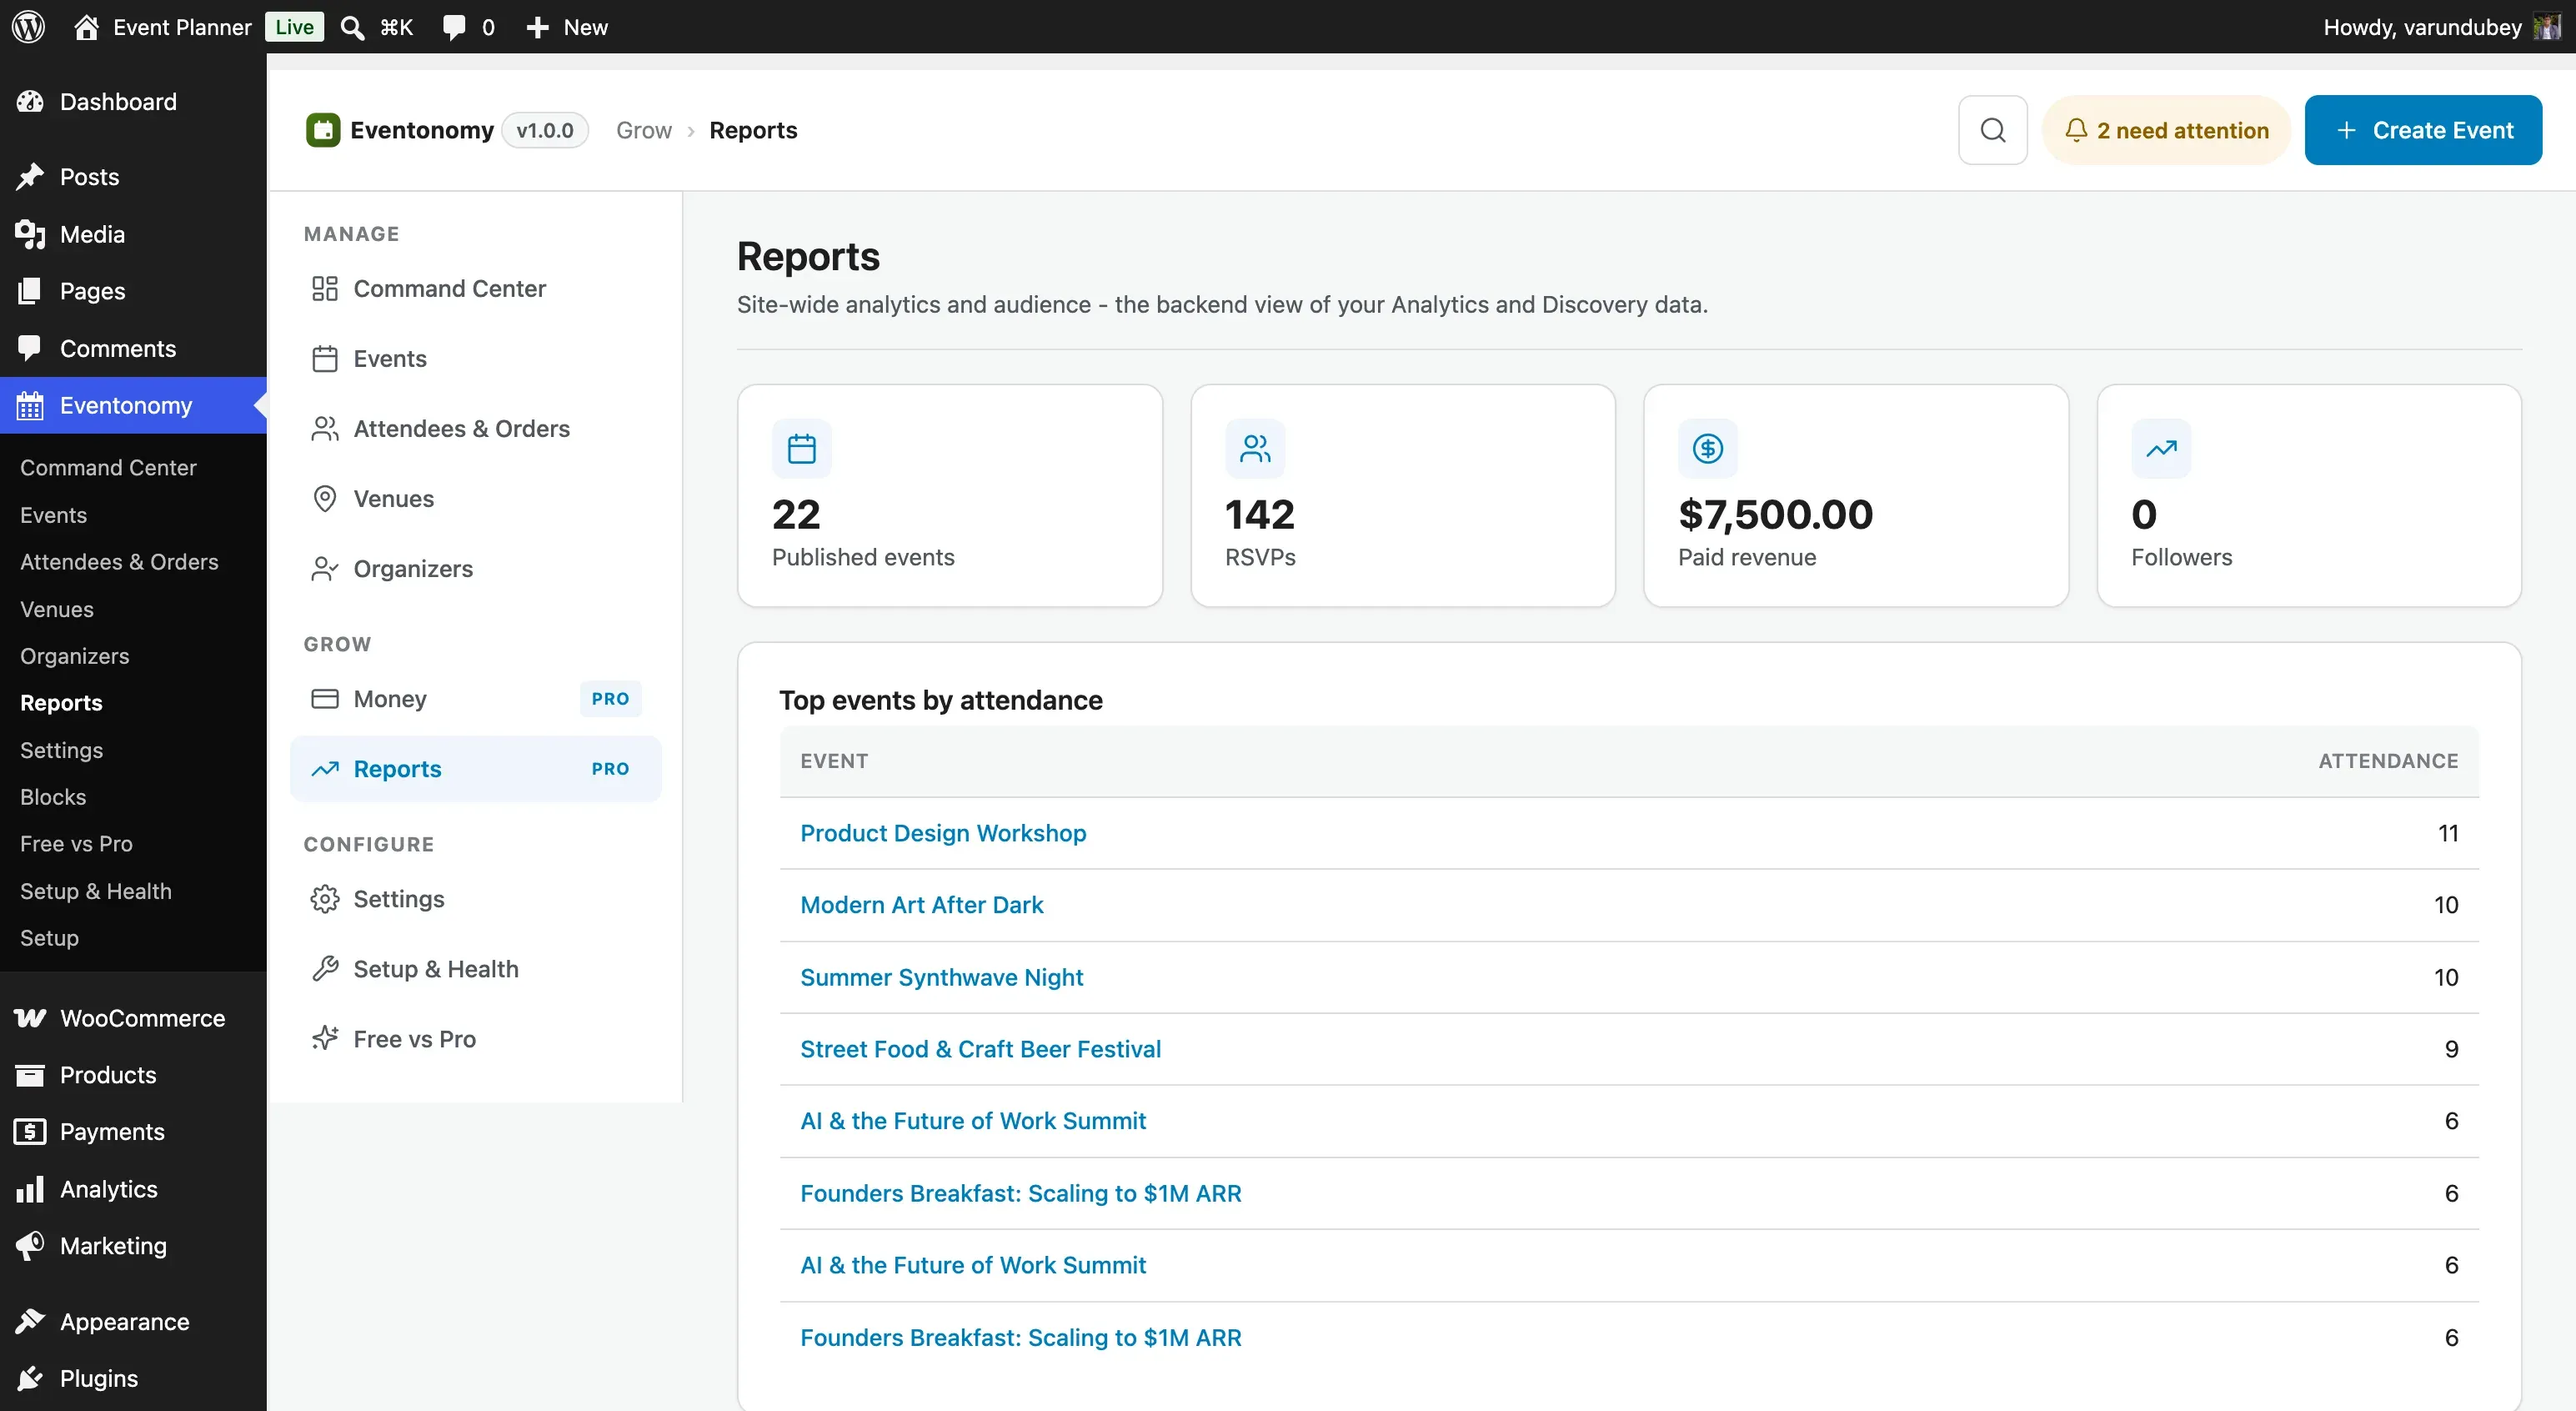
Section titled “Backend Reports Page (Admin)”The admin Reports screen gives site owners a site-wide summary. Go to Eventonomy → Reports in wp-admin.
Note: The Reports page requires the Analytics feature toggle to be on (see above). If it is off, the page shows an “Analytics is turned off” notice with a direct link to the toggle.
KPI Cards
Section titled “KPI Cards”The top of the Reports page shows four summary cards:
| KPI | Description |
|---|---|
| Published events | Total count of events with status = published. |
| RSVPs | Aggregate RSVP count across all events and all statuses. |
| Paid revenue | Sum of all paid order totals, formatted in your store currency. |
| Followers | Total organizer and event follows via the Pro follow system. |
Top Events by Attendance
Section titled “Top Events by Attendance”Below the KPI cards, a table lists your top events ranked by total RSVP count. Each row links to the event’s admin edit screen.
Audience
Section titled “Audience”The Audience card shows:
- Organizer follows - how many members have followed at least one organizer.
- Saved events - how many event-follow records exist (members who clicked Follow on an event).
These numbers are derived from the evnm_follows table owned by Pro.
What’s Next?
Section titled “What’s Next?”Learn how to use the door check-in scanner at your events.