

Video Analytics
Requires MediaVerse Pro - This feature is available exclusively in the Pro version.
MediaVerse Pro records play events for every video, builds per-video heatmaps, and provides a dashboard showing retention and engagement metrics.
How Event Tracking Works
Section titled “How Event Tracking Works”The player fires events to the REST API as viewers interact with a video. Events are rate-limited to one event per second per session to prevent flooding. Anonymous viewers are tracked by session ID; authenticated users are tracked by user ID.
Tracked Events
Section titled “Tracked Events”| Event | Fired When |
|---|---|
play |
Playback starts or resumes |
pause |
Playback is paused |
seek |
User jumps to a new position |
complete |
Playback reaches the end of the video |
buffer |
Player enters a buffering state |
Events are written to the mvs_play_events database table.
Database Table: mvs_play_events
Section titled “Database Table: mvs_play_events”| Column | Type | Description |
|---|---|---|
id |
bigint | Auto-increment primary key |
media_id |
bigint | The mvs_media post ID |
user_id |
bigint | WordPress user ID, or NULL for anonymous |
session_id |
varchar(64) | Unique session identifier |
event_type |
varchar(20) | Event type: play, pause, seek, complete, buffer |
position_seconds |
float | Playback position in seconds when the event fired |
duration_seconds |
float | Total video duration in seconds (nullable) |
created_at |
datetime | UTC timestamp |
Data Retention
Section titled “Data Retention”A daily WP-Cron job (mvs_pro_prune_play_events) prunes raw event rows; the default retention window is 90 days. There is no dedicated retention-days setting option.
REST API
Section titled “REST API”Base URL: /wp-json/mvs-pro/v1/
POST /media/{id}/events
Section titled “POST /media/{id}/events”Record a single play event. Authentication is not required - anonymous events are accepted.
Body:
{ "event_type": "play", "position": 0, "duration": 360, "session_id": "abc123xyz"}event_type must be one of play, pause, seek, complete, buffer. session_id should be a stable string generated client-side per browser session (e.g. a UUID stored in sessionStorage). Events are rate-limited per session inside the service.
Response: 204 No Content.
GET /media/{id}/analytics
Section titled “GET /media/{id}/analytics”Get the full analytics bundle for a single media item in one request: heatmap, retention curve, completion rate, average watch duration, engagement score, and drop-off points. Requires ownership or admin (manage_mvs_settings).
Response:
{ "media_id": 123, "heatmap": [42, 41, 40, 39, 38, 12, 12, 11], "retention_curve": [100, 98, 97, 95, 60, 58], "completion_rate": 0.42, "avg_duration": 148, "engagement_score": 0.61, "drop_offs": [45, 120, 240]}avg_duration is in seconds. completion_rate is a decimal between 0 and 1. The retention_curve and heatmap are normalised arrays; pass an optional bucket_count query argument to control the heatmap resolution.
Admin-only aggregate routes
Section titled “Admin-only aggregate routes”Two site-wide routes require the manage_mvs_settings capability:
GET /analytics/top- top media items by play activity.GET /analytics/overview- aggregate analytics across all media.
Viewing Analytics in WP Admin
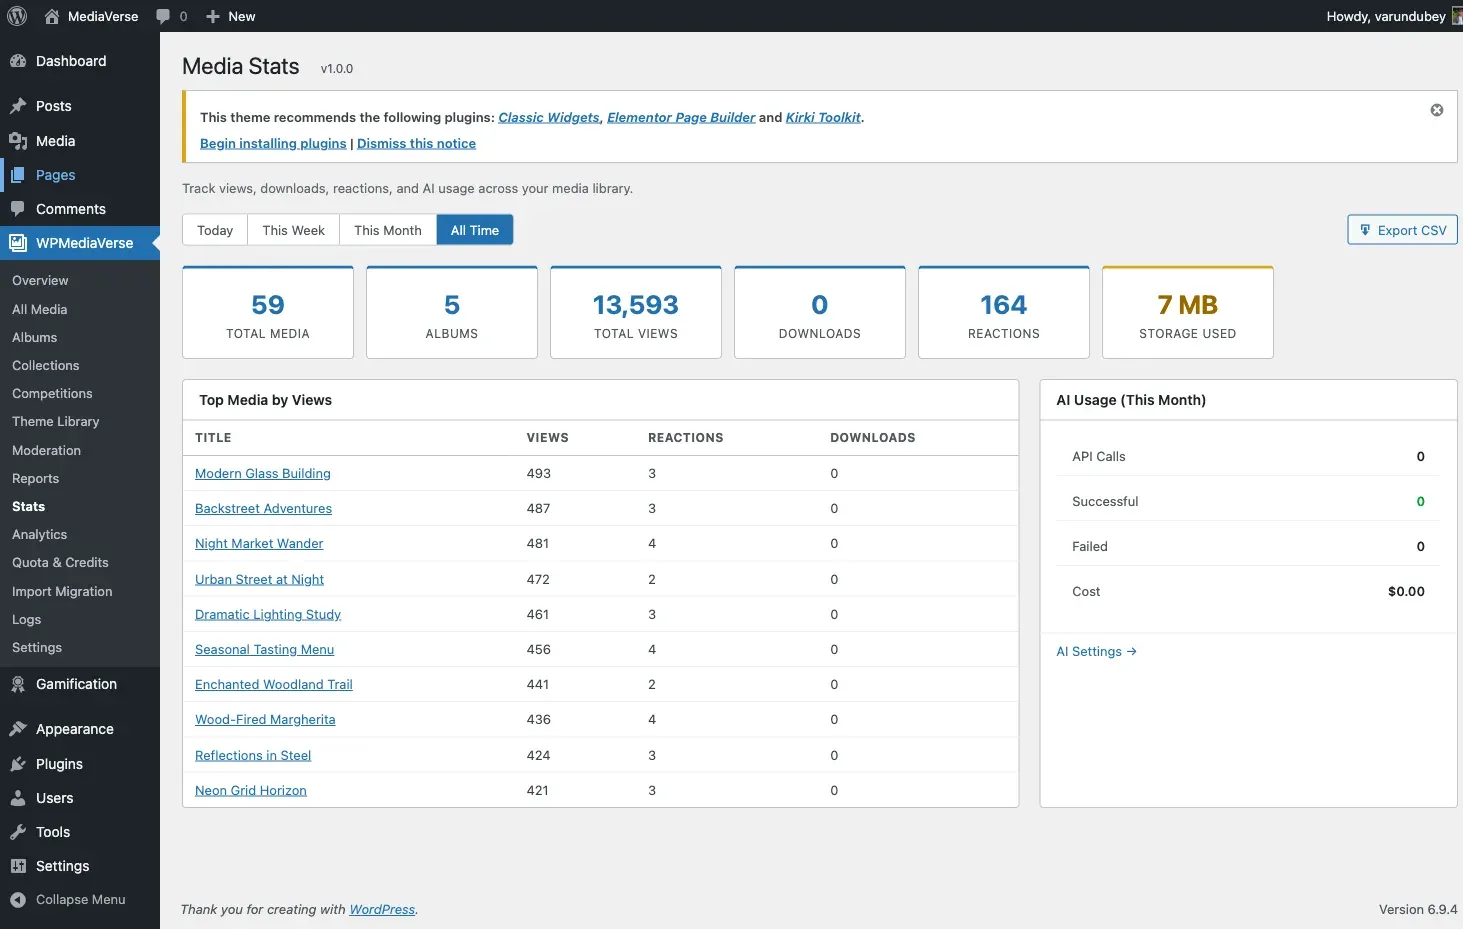
Section titled “Viewing Analytics in WP Admin”Pro adds a Video Analytics tab to the Media > Stats page (the AnalyticsDashboard, injected via the mvs_stats_tabs filter). It includes a per-media detail view with the full heatmap, retention curve, and drop-off table.