

Admin Analytics [PRO]
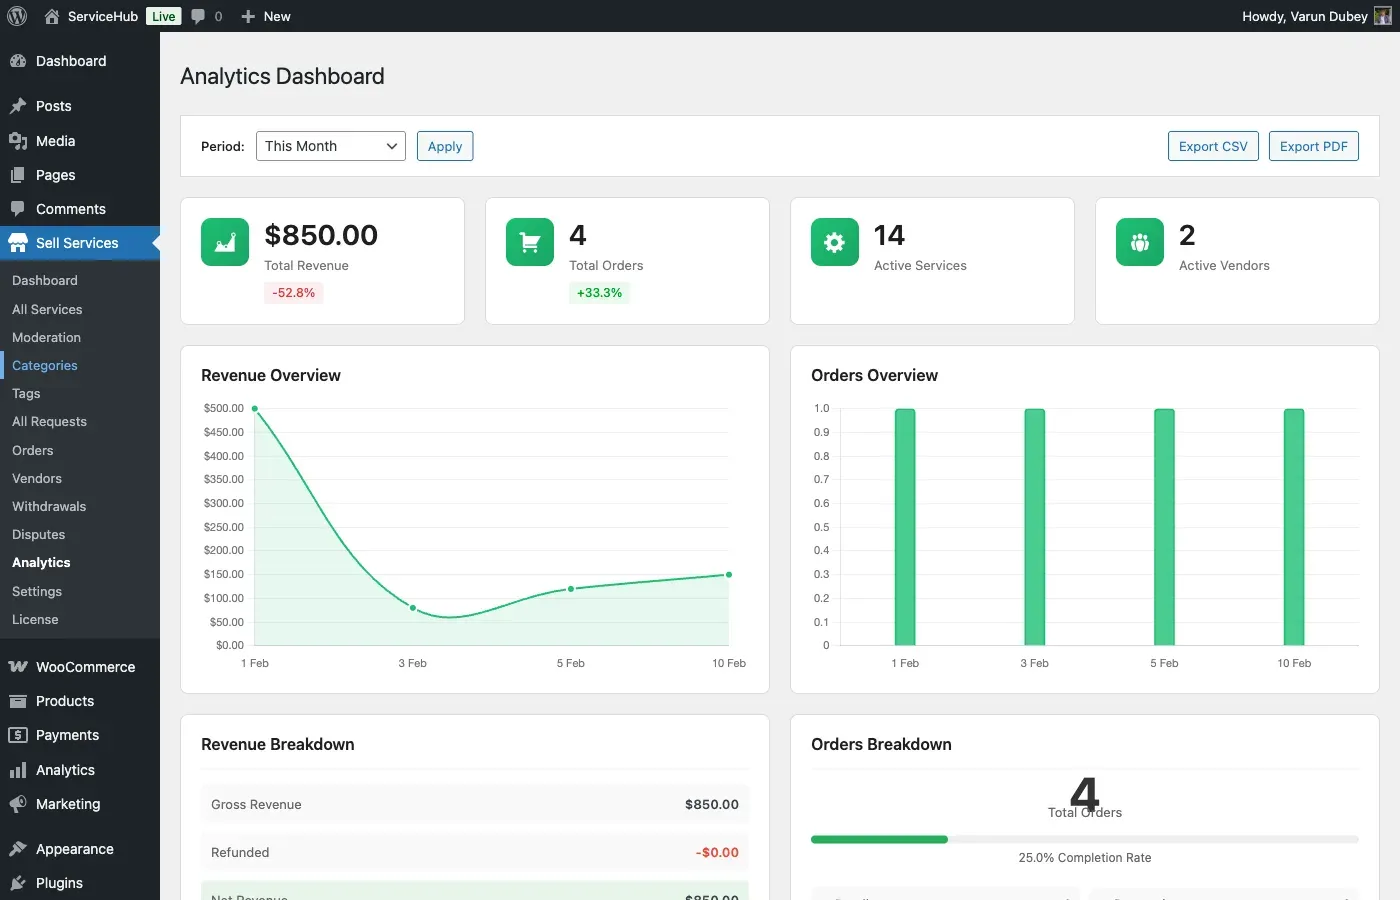
Get a bird’s-eye view of your entire marketplace with the admin analytics dashboard. Track revenue, monitor vendor performance, and spot trends – all from one screen.
What You Can See
Section titled “What You Can See”The analytics dashboard gives you a real-time overview of your marketplace health:
Revenue Overview
Section titled “Revenue Overview”- Total revenue across all completed orders
- Revenue charts showing trends over 7 days, 30 days, 90 days, or 12 months
- Commission earned by the platform
Order Statistics
Section titled “Order Statistics”- Total orders and their status breakdown (pending, in progress, completed, cancelled)
- Recent orders list with quick access to details
- Order volume trends over time
Top Performers
Section titled “Top Performers”- Top services ranked by revenue, orders, or ratings
- Top vendors ranked by rating, earnings, or order count
- Top categories showing where the most activity is concentrated
Marketplace Counts
Section titled “Marketplace Counts”- Total registered vendors
- Total published services
- Total orders processed
- Active buyer count
Time Period Filters
Section titled “Time Period Filters”Switch between different time ranges to analyze trends:
| Period | What It Shows |
|---|---|
| 7 days | Daily breakdown for the past week |
| 30 days | Daily breakdown for the past month |
| 90 days | Weekly trends for the past quarter |
| 12 months | Monthly trends for the past year |
Dashboard Overview
Section titled “Dashboard Overview”The dashboard is designed for quick scanning. At the top, you see the headline numbers (total revenue, orders, vendors, services). Below that, charts visualize trends. At the bottom, tables list your top services, top vendors, and recent orders.
Everything updates as new orders are completed, so the data you see reflects the current state of your marketplace.
What Is Included in the Free Version
Section titled “What Is Included in the Free Version”The free version provides basic marketplace counts: total vendors, services, orders, and revenue. The full analytics dashboard with charts, time filters, trend analysis, and detailed breakdowns is a Pro feature.
Related Guides
Section titled “Related Guides”- Vendor Analytics – Individual vendor performance tracking
- Data Export – Export your analytics data